Photographer: Unknown
Date: 17.08.2007
Original URL: https://nsidc.org/data/glacier_photo/search/image_info/gulkana20070817?order=true
Citation: Unknown. 2007. Gulkana Glacier: From the Glacier Photograph Collection. Boulder, Colorado USA: National Snow and Ice Data Center. Digital media.
License: All rights reserved
Methods
This page describes the methodologies used for estimating the year where the glacier is ‘mostly gone’ and for the glacier projection visualizations. The detailed explanations provided below are somewhat technical and might be challenging for non-scientists, but we have included them here to ensure full transparency.
Overview
We simulate individual glacier thickness and volume projections from 2000 to 2100 using climate scenarios (climate models and emission scenarios) from CMIP5 and CMIP6 and large-scale glacier models. We primarily focus on 2.7°C global warming above pre-industrial by 2100, as this represents the predicted real-world outcome of current policies and actions. For comparison, we also include projections under the 1.5°C target of the Paris Agreement. We chose climate scenarios with a range of ±0.2°C from 1.5°C or 2.7°C.
The warming levels are defined as the 2071–2100 global mean temperature difference relative to 1850–1900, with a 0.69°C warming from 1850–1900 to 1986–2005 (ref. IPCC AR6).
Definition of a glacier being ‘mostly gone’
We define ‘mostly gone’ as the year when either less than 10% of the glacier’s 2020 volume or less than 0.01 km³ is expected to be left - whichever threshold is crossed first. While small ice patches might persist beyond this year, the landscape will be very different compared to the current one. This 10%-threshold is considered appropriate for the Alps and regions with similar glaciers in terms of geometry. Using both thresholds ensures we can define ‘mostly gone’ for both, relatively large Alpine glaciers and those already very small today.
It is important to note that positive feedback mechanisms, such as localized warming due to glacier retreat, are not accounted for in large-scale glacier models. This means that, while the glacier changes we use here are the most reliable projections available, the actual glacier retreat may occur faster.
Threshold definition differences
We find that our definition of a glacier being ‘mostly gone’ is, in the median, 9 years earlier in the Alps when using the two thresholds (<10% or <0.01 km³) compared to just using <10%. Compared to using only the <10% threshold, the maximum difference can mean a glacier is mostly gone 73 years earlier and that fewer glaciers survive until the end of the century.
Changing the definition from a 10% threshold to a 5% threshold results in glaciers being ‘mostly gone’, in the median, four years later, and max. 34 years later. For approximately 40 glaciers, the remaining glacier volume in 2100 is between 5% and 10%, meaning these glaciers would survive until the end of the century under the 5% threshold.
Likely range
The likely range describes the spread of projections and is defined as the
17th to 83rd percentiles, consistent with IPCC AR6.
If the data follow a Gaussian distribution, this range corresponds approximately
to one standard deviation (±1σ) from the mean, capturing about 68% of the
available projections.
Glacier projection data sources and models
The 2020 glacier volume, year where we estimate the glacier to be mostly gone, and global and regional glacier volume change projections are derived from these three glacier models (specific model versions and data further summarized in Zekollari et al. (2024)) by simulating each of the >200,000 glaciers individually:
- OGGM v1.6.1
- PyGEM-OGGM
- Data: DOI
- Documentation: PyGEM
- Details:
- CMIP5 and CMIP6 available.
- Same scenarios as presented in Rounce et al., 2023.
- For 2.7±0.2°C: n=7 climate scenarios
- For 1.5±0.2°C: n=9 climate scenarios
- GloGEM
- Data: DOI
- Documentation: Huss & Hock (2015)
- Details:
- CMIP6 only.
- For 2.7±0.2°C: n=3 climate scenarios
- For 1.5±0.2°C: n=4 climate scenarios
The 3D glacier thickness projections are based solely on OGGM simulations and visualized using the Glacier:3D-Viz tool. These 3D projections differ slightly from the other estimates, which are based on a combination of three glacier models.
Note that these glacier projections are based on global glacier models that use globally available glacier observation data. Data that are only available for a few glaciers (i.e., only geodetic but no in-situ observations directly used) is not included. As a result, the models perform better on a global scale than at the individual glacier scale. Although some important processes at the individual glacier scale are not represented, we present individual glacier results here for educational purposes. In addition, the per-glacier and regional volume in 2020 is not an observed volume but a modelled volume (it is the glacier model median estimate of the multi-climate-model medians).
Results aggregation
For the 2020 glacier volume, deglaciation year, and regional glacier volume change projections, we present the median and the likely range across all available combinations of glacier models and climate scenarios. Since OGGM includes more climate scenarios, its projections contribute the most weight to the overall results.
The mean global warming above pre-industrial across all combinations of glacier models and climate scenarios is:
- 1.57°C for the 1.5±0.2°C range.
- 2.71°C for the 2.7±0.2°C range.
Photo sources and licenses
Photographer: Varina Crisfield
Date: 28.07.2014
Original URL: https://nsidc.org/data/glacier_photo/search/image_info/athabasca20140728?order=true
Citation: Crisfield, Varina. 2014. Athabasca Glacier: From the Glacier Photograph Collection. Boulder, Colorado USA: National Snow and Ice Data Center. Digital media.
License: All rights reserved
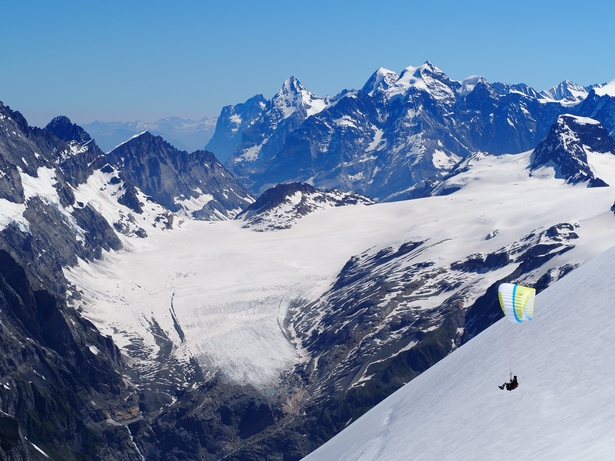
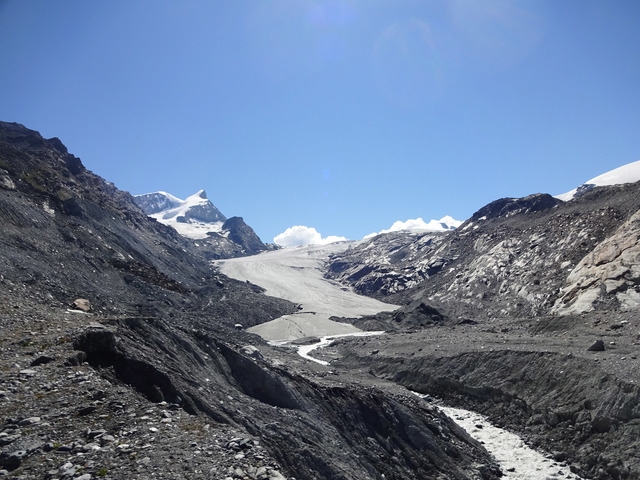
Photographer: Jurg Alean
Date: 02.07.2008
Original URL: https://nsidc.org/data/glacier_photo/search/image_info/white20080702?order=true
Citation: Alean, Jurg. 2008. White Glacier: From the Glacier Photograph Collection. Boulder, Colorado USA: National Snow and Ice Data Center. Digital media.
License: All rights reserved
Date: 02.07.2008
Original URL: https://nsidc.org/data/glacier_photo/search/image_info/white20080702?order=true
Citation: Alean, Jurg. 2008. White Glacier: From the Glacier Photograph Collection. Boulder, Colorado USA: National Snow and Ice Data Center. Digital media.
License: All rights reserved
Photographer: Alean, Jurg
Date: 07.08.2009
Original URL: https://nsidc.org/data/glacier_photo/search/image_info/hallstaetter20090807
Citation: Alean, Jurg. 2009. Hallstatter Glacier: From the Glacier Photograph Collection. Boulder, Colorado USA: National Snow and Ice Data Center. Digital media.
License: All rights reserved
Date: 07.08.2009
Original URL: https://nsidc.org/data/glacier_photo/search/image_info/hallstaetter20090807
Citation: Alean, Jurg. 2009. Hallstatter Glacier: From the Glacier Photograph Collection. Boulder, Colorado USA: National Snow and Ice Data Center. Digital media.
License: All rights reserved
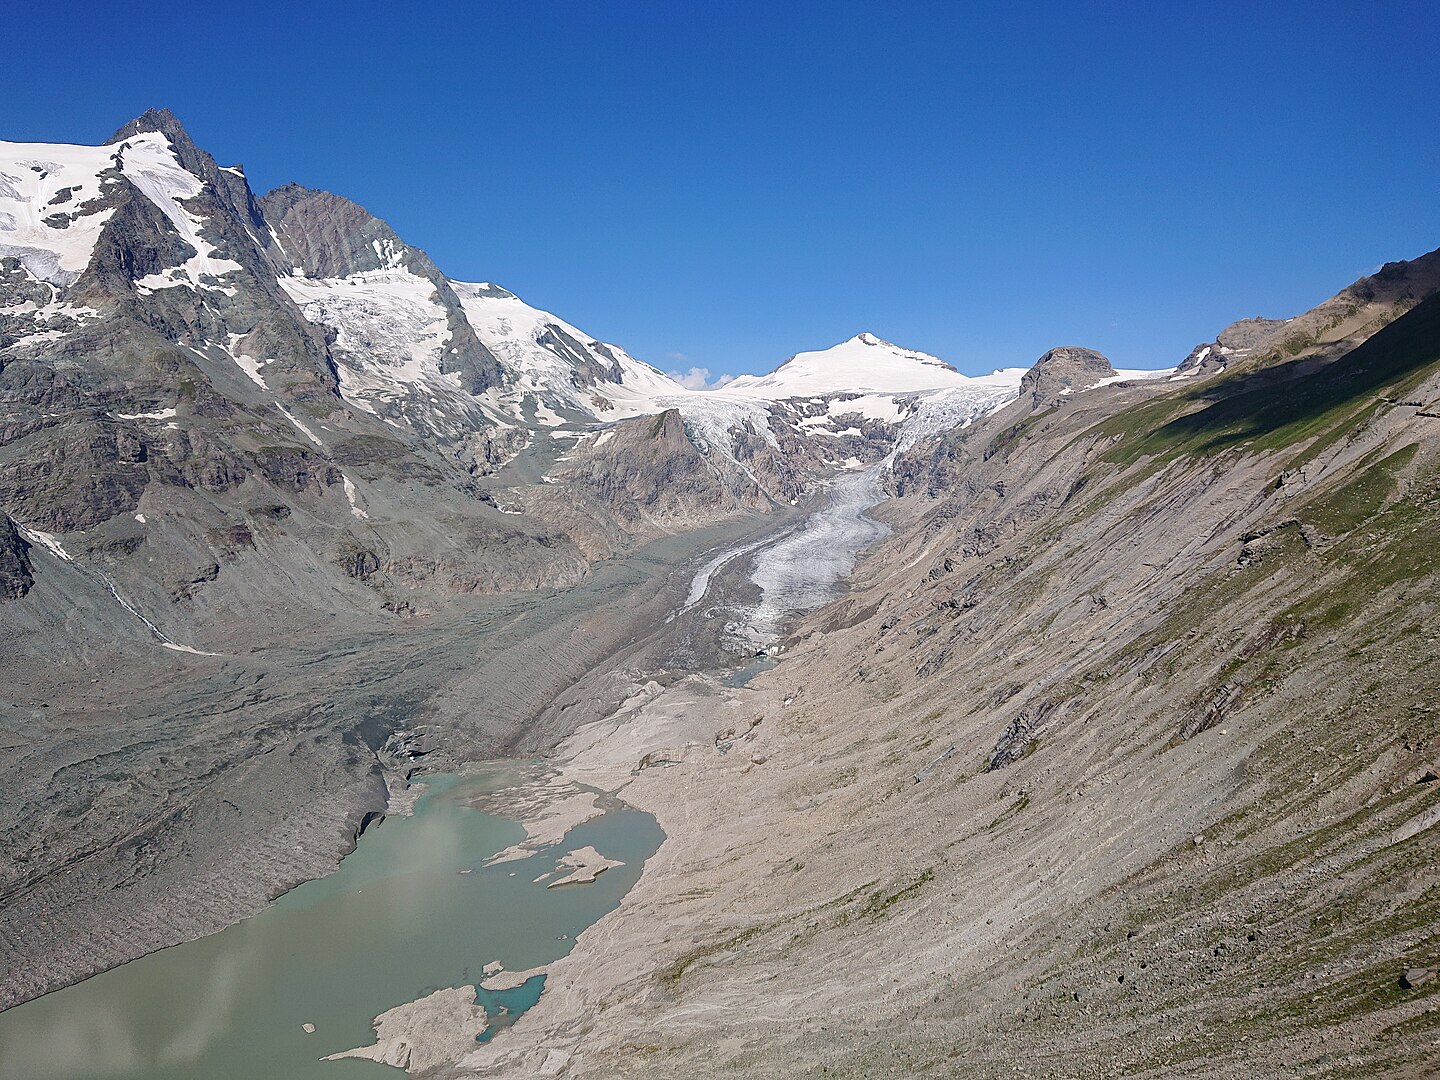
Photographer: Max Baier
Date: 10.08.2020
Original URL: https://commons.wikimedia.org/wiki/File:Pasterze_202008.jpg
License: CC BY-SA 4.0
Date: 10.08.2020
Original URL: https://commons.wikimedia.org/wiki/File:Pasterze_202008.jpg
License: CC BY-SA 4.0
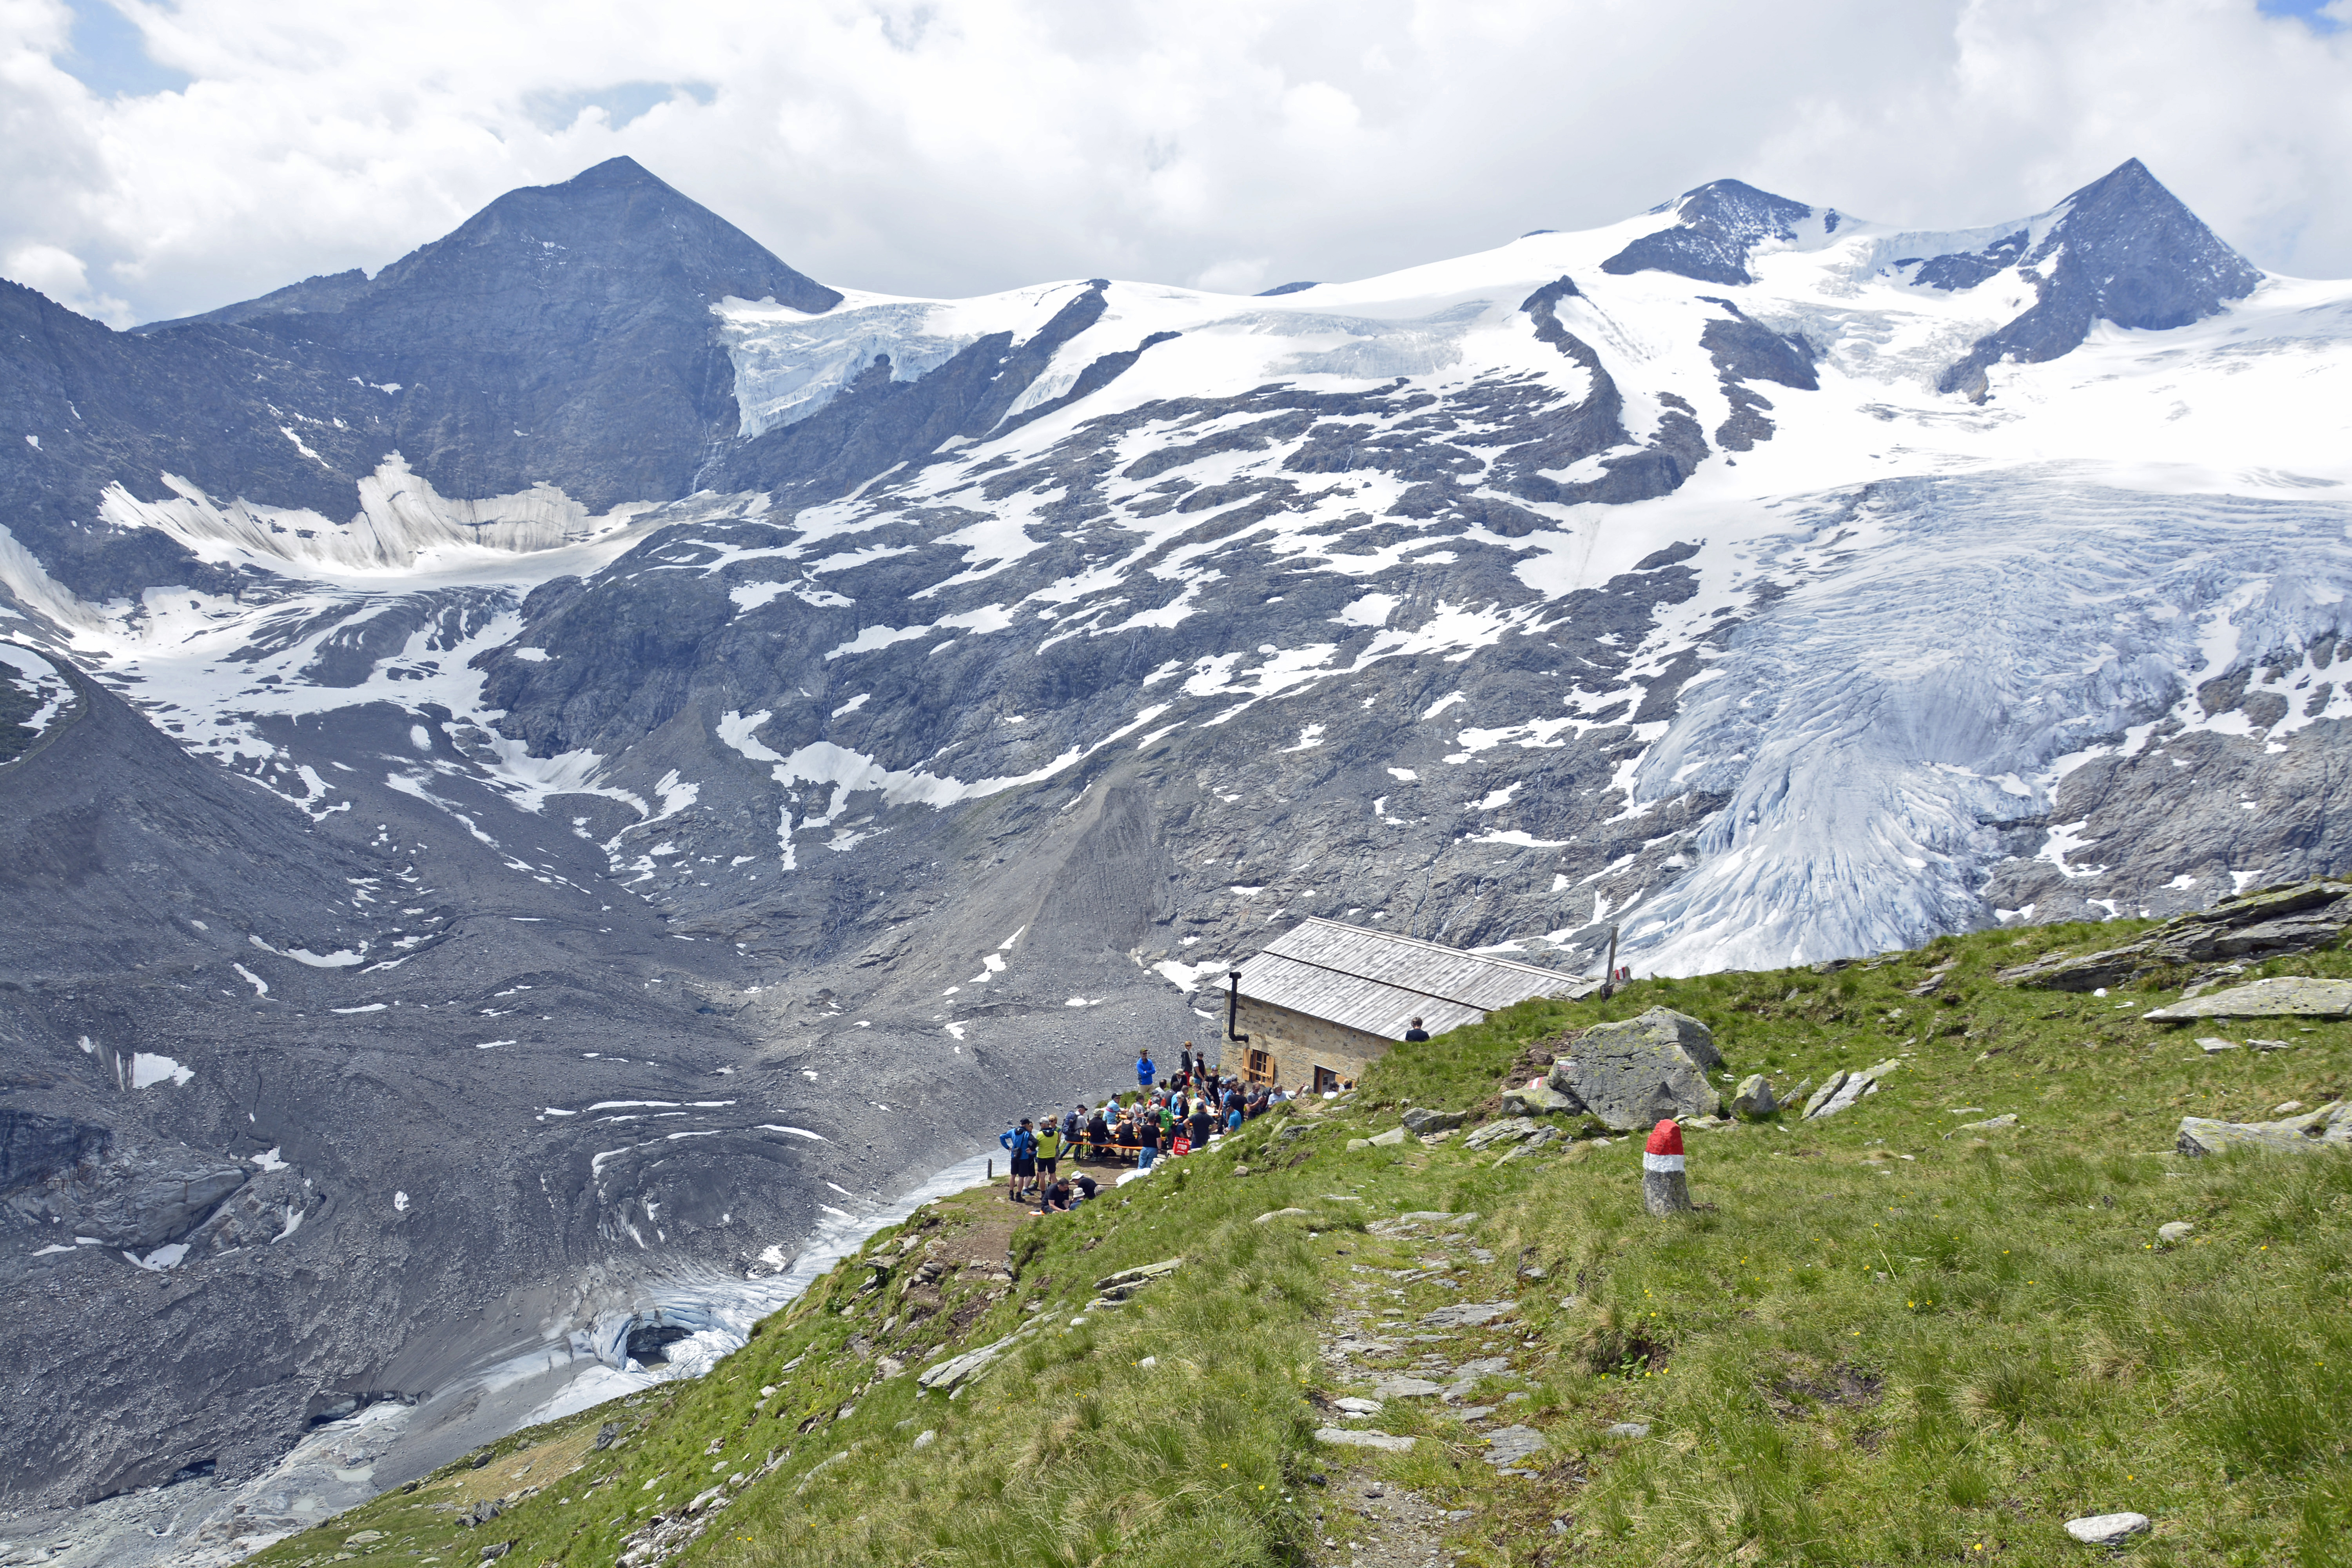
Photographer: Veronika Raich
Date: 2019
Citation: Archiv: Österreichischer Alpenverein
License: All rights reserved
Date: 2019
Citation: Archiv: Österreichischer Alpenverein
License: All rights reserved

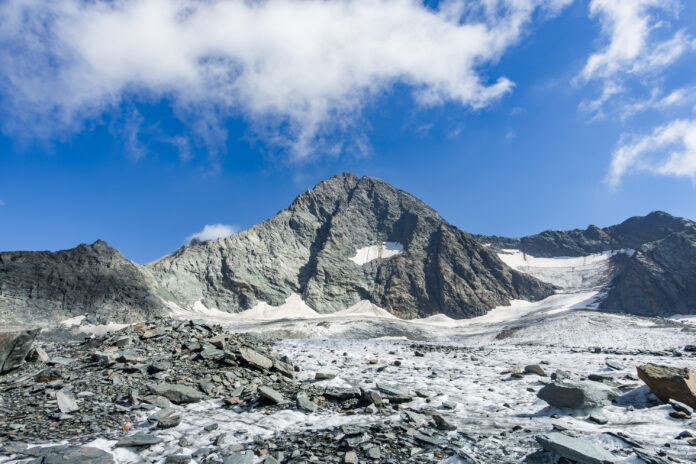
Photographer: Daniel Kubera
Date: 2024
Original URL: https://rauf-und-davon.at/wp-content/uploads/2024/08/grossglockner-stuedlgrat-35-696x464.jpg
License: All rights reserved
Date: 2024
Original URL: https://rauf-und-davon.at/wp-content/uploads/2024/08/grossglockner-stuedlgrat-35-696x464.jpg
License: All rights reserved
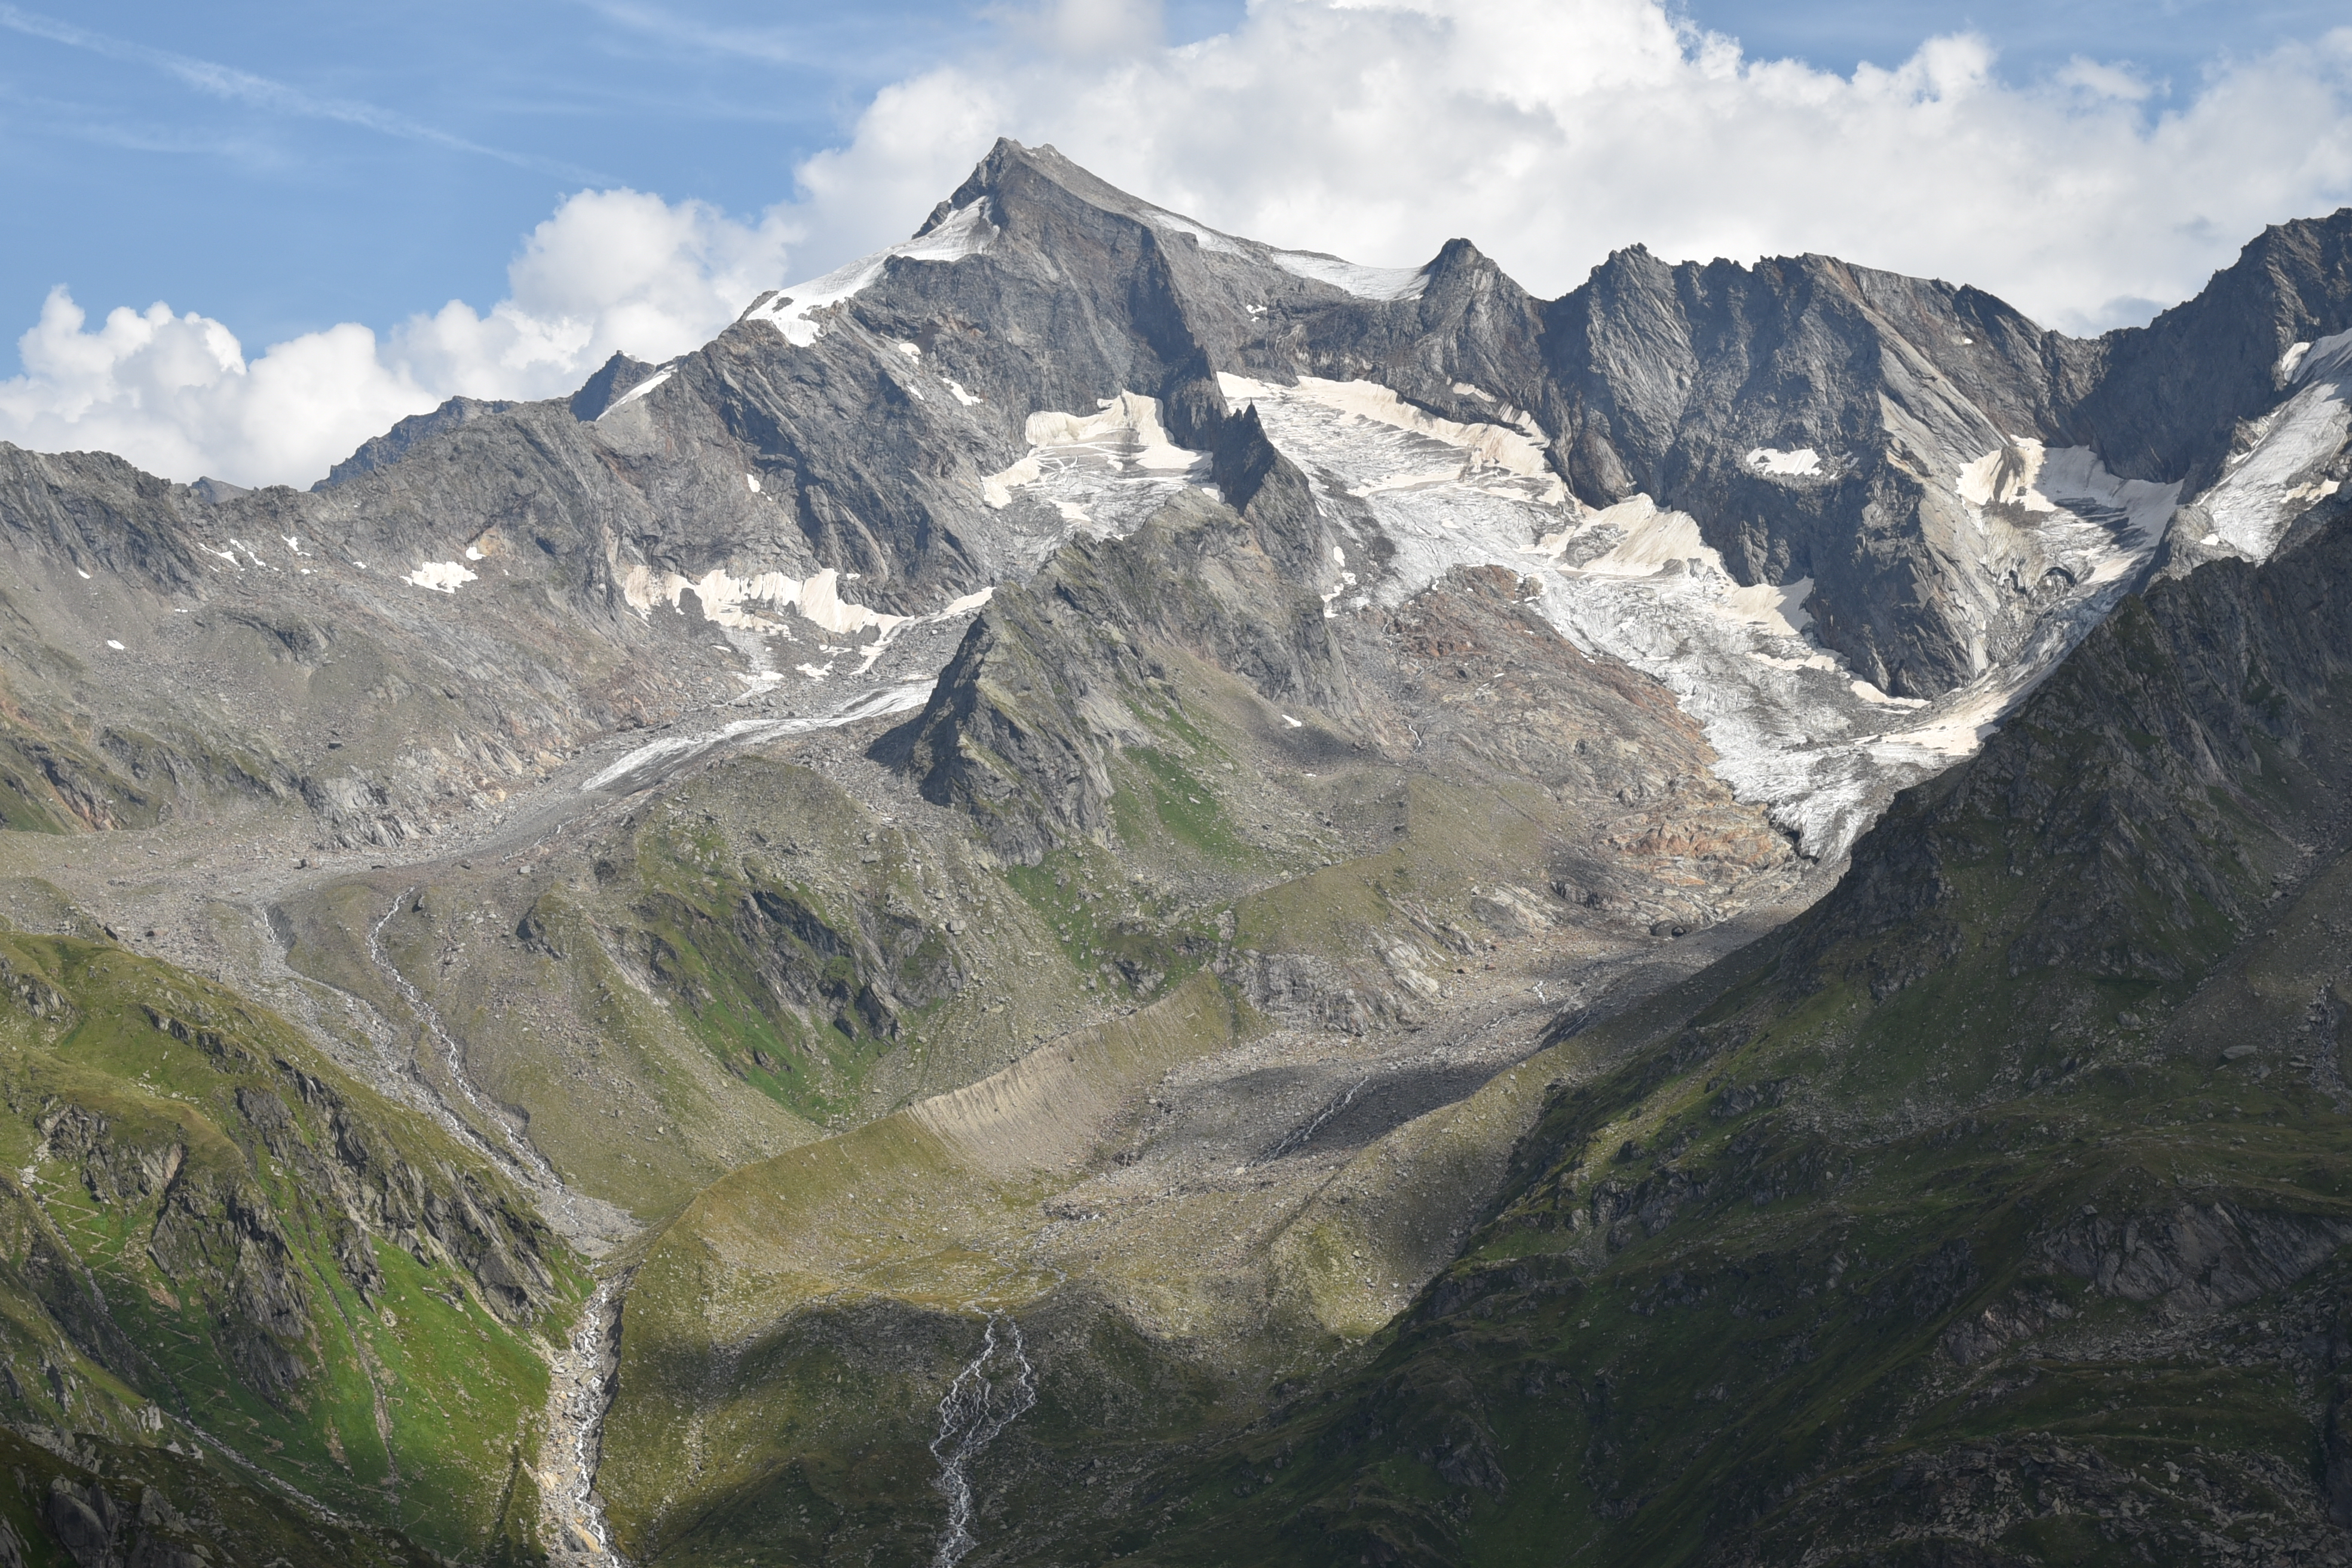
Photographer: Roberto Dinale
Date: 2024
Citation: Archiv: Agentur für Bevölkerungsschutz
License: All rights reserved
Date: 2024
Citation: Archiv: Agentur für Bevölkerungsschutz
License: All rights reserved
Photographer: Jörg Bodenbender
Date: 20XX
Original URL: https://bodenbender-verlag.de/
License: All rights reserved
Date: 20XX
Original URL: https://bodenbender-verlag.de/
License: All rights reserved
Photographer: R. Friedrich
Date: 2020
Citation: ÖAV Gletschermessdienst
License: All rights reserved
Date: 2020
Citation: ÖAV Gletschermessdienst
License: All rights reserved
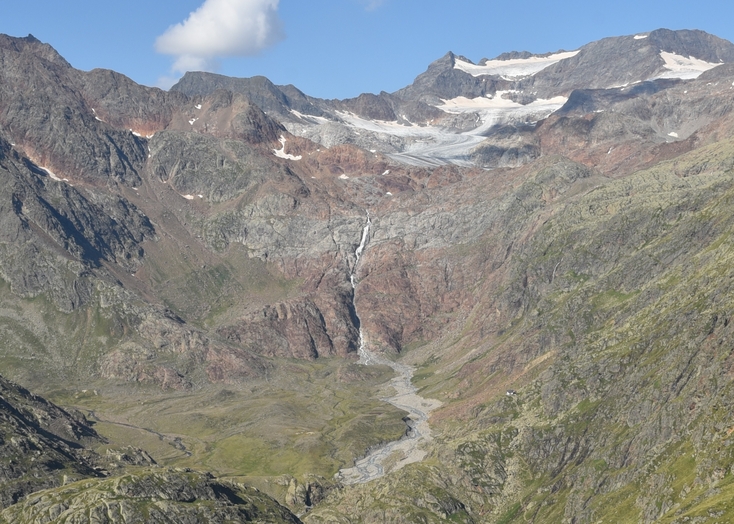
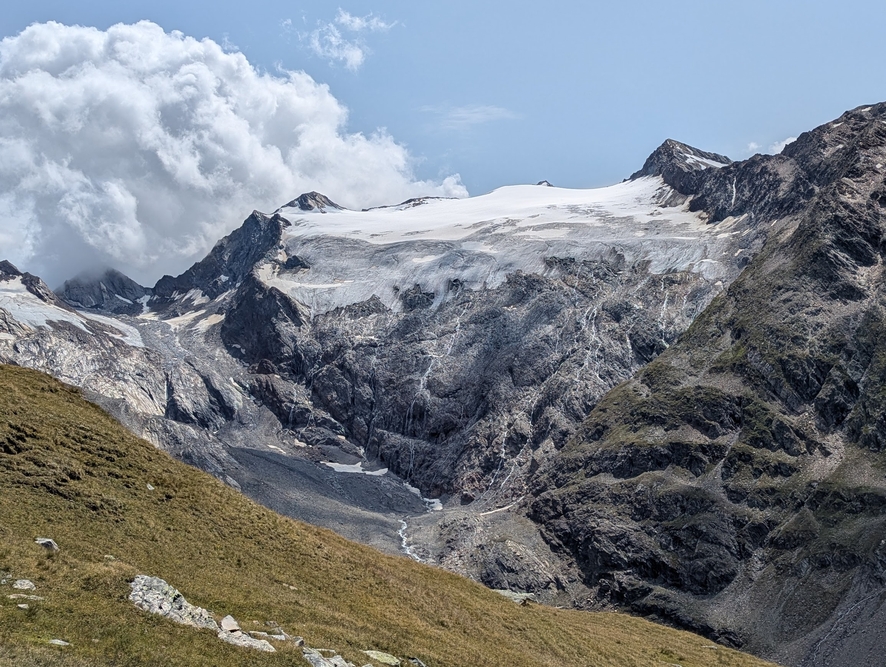
Photographer: Fischer, Mauro
Date: 25.10.2018
Original URL: https://nsidc.org/data/glacier_photo/search/image_info/sulztal-20181025-fischer
Citation: Fischer, Mauro. 2018. Sulztal Ferner Glacier: From the Glacier Photograph Collection. Boulder, Colorado USA: National Snow and Ice Data Center. Digital media.
License: All rights reserved
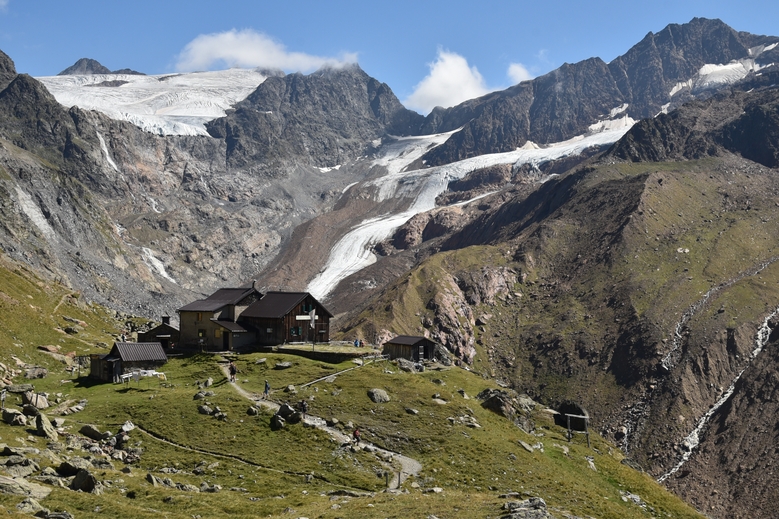
Photographer: Ernst Aigner
Date: 2017
Original URL: https://www.almenrausch.at/touren/detail/egesengrat-2631-m-von-der-dresdner-huette/
License: All rights reserved
Date: 2017
Original URL: https://www.almenrausch.at/touren/detail/egesengrat-2631-m-von-der-dresdner-huette/
License: All rights reserved
Photographer: Roberto Dinale
Date: 2022
Citation: Archiv: Agentur für Bevölkerungsschutz
License: All rights reserved
Date: 2022
Citation: Archiv: Agentur für Bevölkerungsschutz
License: All rights reserved
Photographer: Christoph Oberschmied (Agenzia per la Protezione civile)
Date: 2024
Copyright: By downloading the images, the user declares that the use of the photos is authorized in compliance with Directive (EU) 2019/790 on copyright, and must include the following metadata: subject: glacier and valley/mountain group of reference; full name of the photographer; year the photo was taken; and full name of the owner or archive from which the photo originates
License: All rights reserved
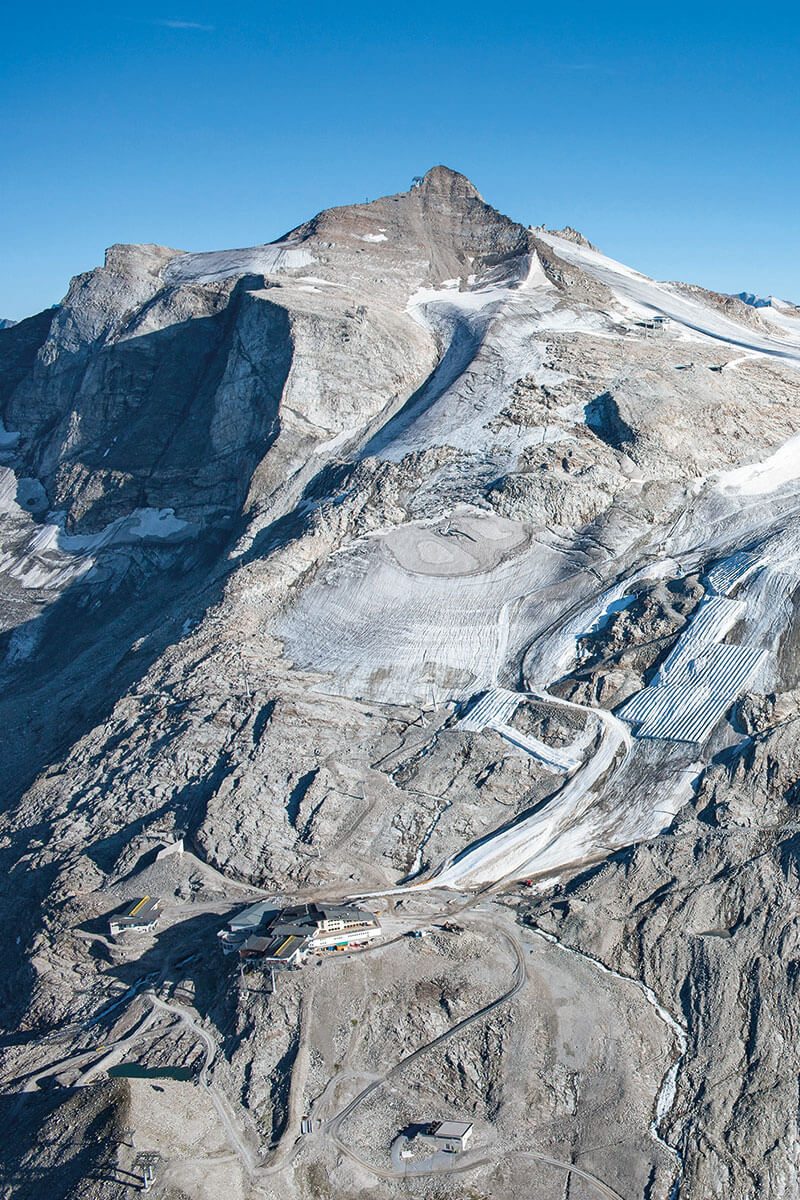
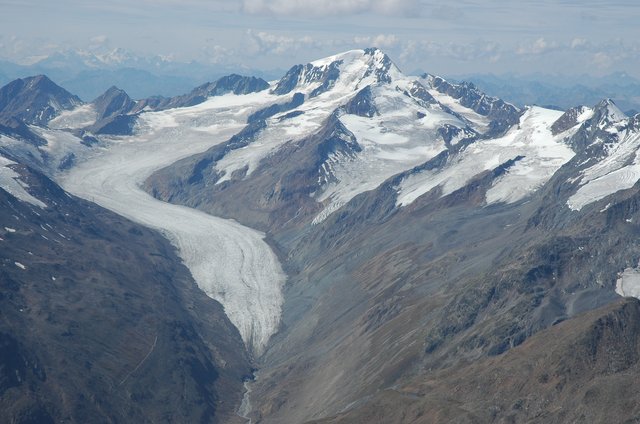
Photographer: Jakob Abermann
Date: 09.09.2008
Original URL: https://nsidc.org/data/glacier_photo/search/image_info/mittelbergferner20080909
Citation: Abermann, Jakob. 2008. Mittelbergferner Glacier: From the Glacier Photograph Collection. Boulder, Colorado USA: National Snow and Ice Data Center. Digital media.
License: All rights reserved
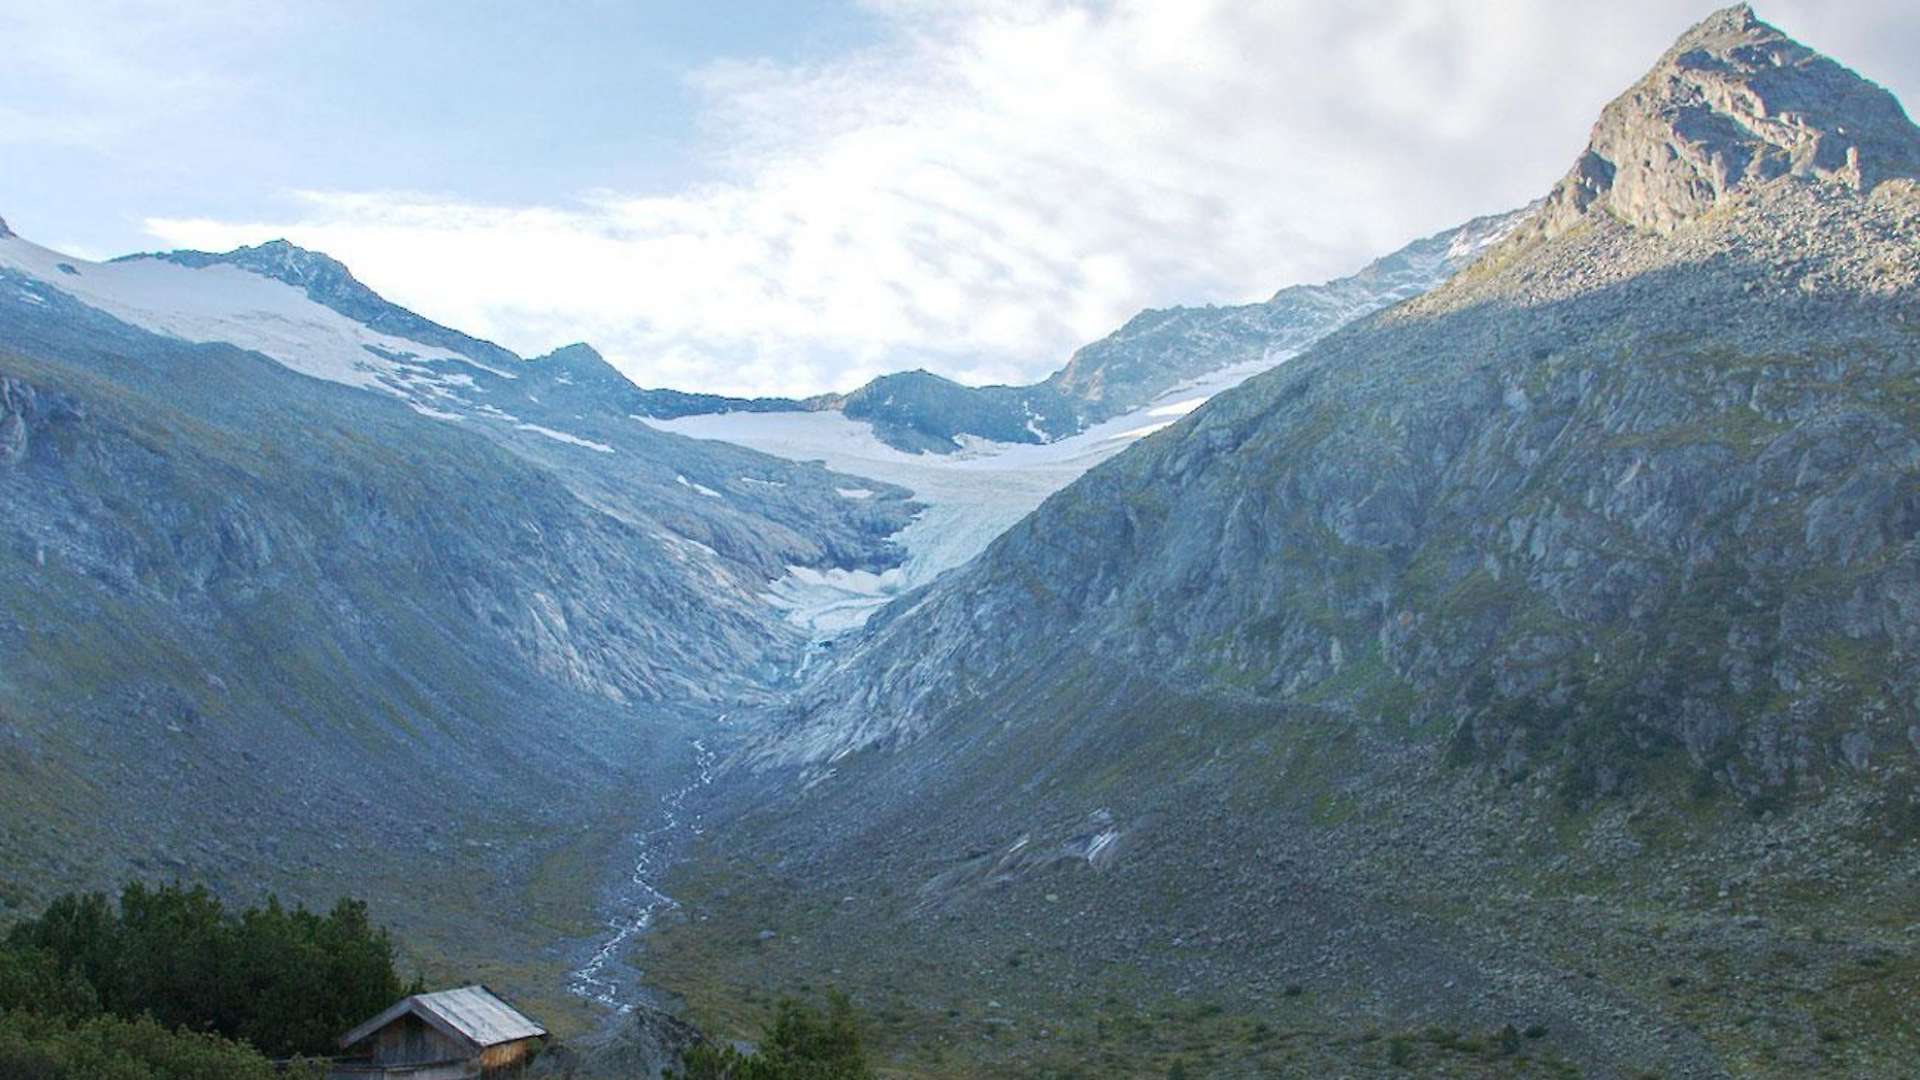
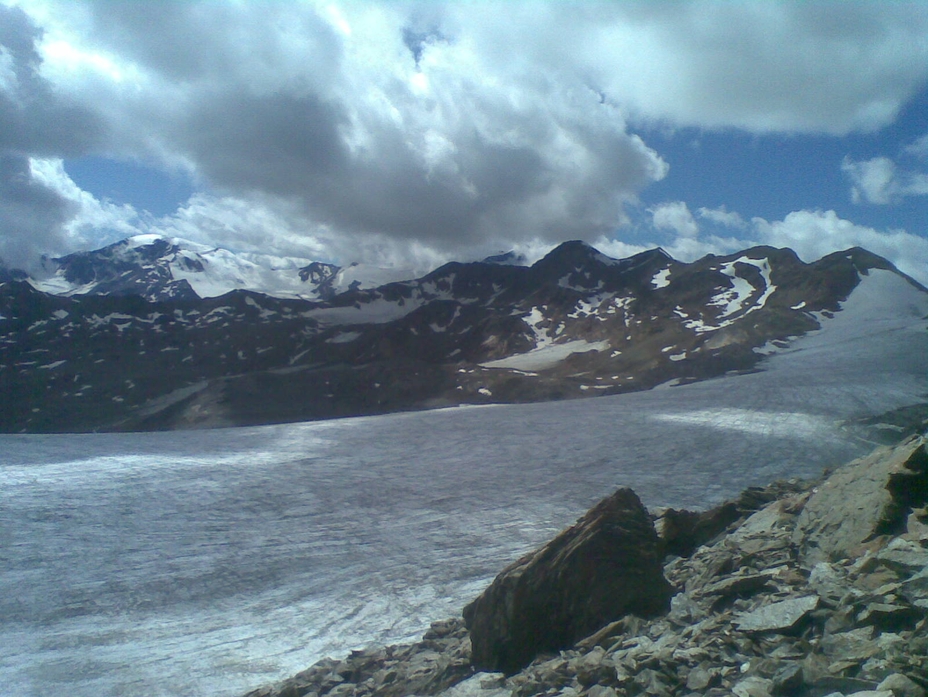
Photographer: Jakob Abermann
Date: 09.09.2008
Original URL: https://nsidc.org/data/glacier_photo/search/image_info/taschachferner20080909?order=true
Citation: Abermann, Jakob. 2008. Taschachferner Glacier: From the Glacier Photograph Collection. Boulder, Colorado USA: National Snow and Ice Data Center. Digital media.
License: All rights reserved
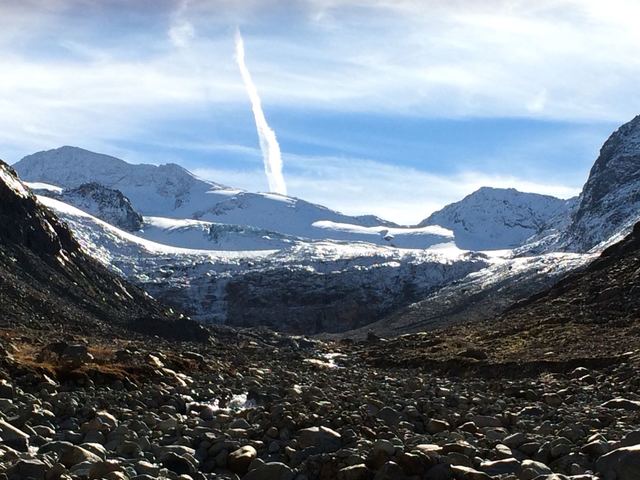
Photographer: Siebers, M.
Date: 2017
Citation: Siebers, M.. 2017. Vernagt Ferner Glacier: From the Glacier Photograph Collection. Boulder, Colorado USA: National Snow and Ice Data Center. Digital media.
License: All rights reserved
Date: 2017
Citation: Siebers, M.. 2017. Vernagt Ferner Glacier: From the Glacier Photograph Collection. Boulder, Colorado USA: National Snow and Ice Data Center. Digital media.
License: All rights reserved
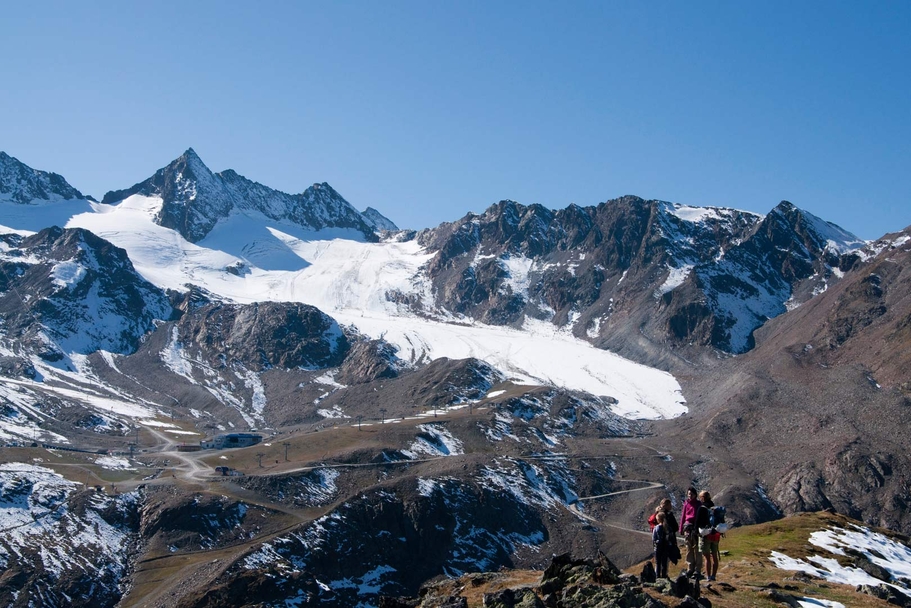
Photographer: Jakob Abermann
Date: 09.09.2008
Original URL: https://nsidc.org/data/glacier_photo/search/image_info/gepatschferner20080909
Citation: Abermann, Jakob. 2008. Gepatschferner Glacier: From the Glacier Photograph Collection. Boulder, Colorado USA: National Snow and Ice Data Center. Digital media.
License: All rights reserved
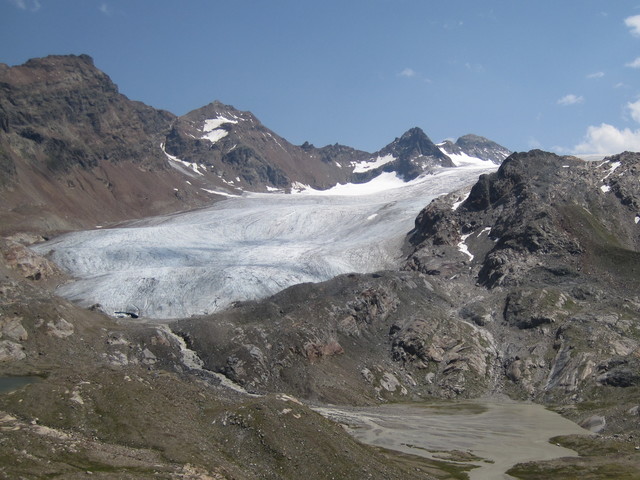
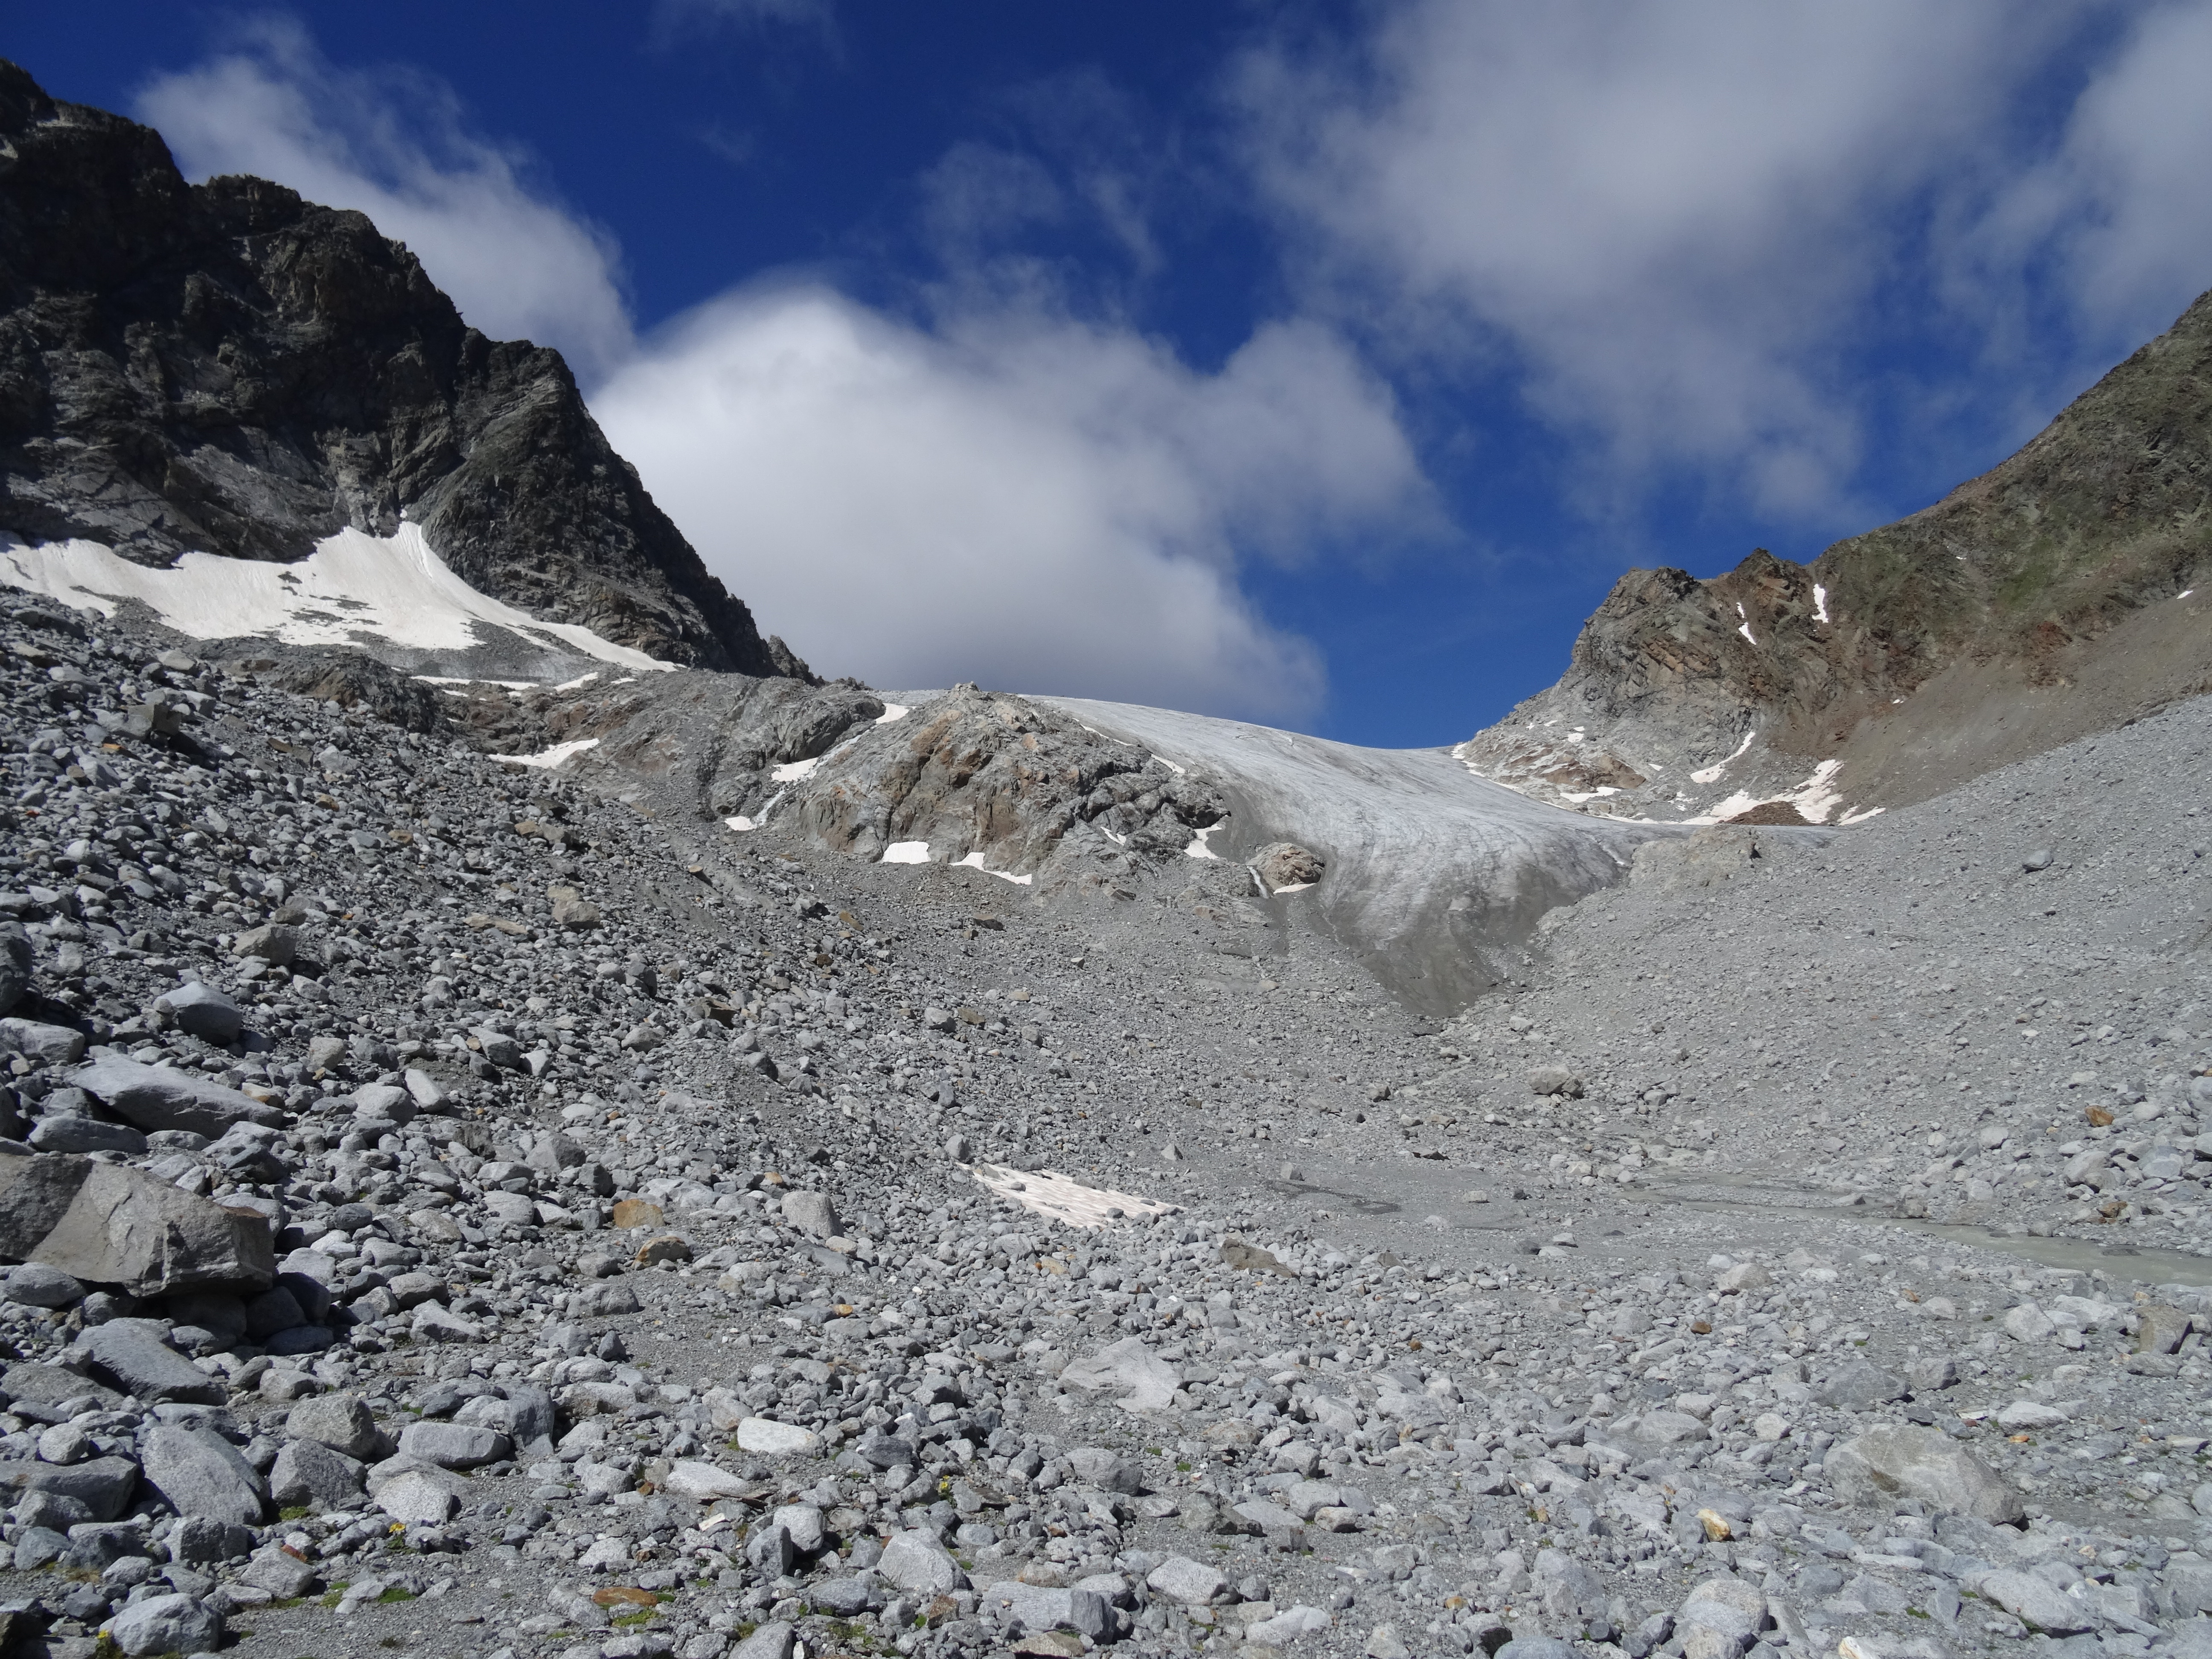
Photographer: Bauder, Andreas
Date: 01.08.2017
Original URL: https://nsidc.org/data/glacier_photo/search/image_info/silvretta-20170801-bauder
Citation: Bauder, Andreas. 2017. Silvretta Glacier: From the Glacier Photograph Collection. Boulder, Colorado USA: National Snow and Ice Data Center. Digital media.
License: All rights reserved
Photographer: Steffen Flaischlen
Date: 07.09.2016
Original URL: https://de.wikipedia.org/wiki/Datei:Gaisbergferner_2016_-1.jpg
License: CC BY-SA 4.0
Date: 07.09.2016
Original URL: https://de.wikipedia.org/wiki/Datei:Gaisbergferner_2016_-1.jpg
License: CC BY-SA 4.0
Photographer: Christoph Oberschmied (Agenzia per la Protezione civile)
Date: 2024
Copyright: By downloading the images, the user declares that the use of the photos is authorized in compliance with Directive (EU) 2019/790 on copyright, and must include the following metadata: subject: glacier and valley/mountain group of reference; full name of the photographer; year the photo was taken; and full name of the owner or archive from which the photo originates
License: All rights reserved
Date: 2024
Copyright: By downloading the images, the user declares that the use of the photos is authorized in compliance with Directive (EU) 2019/790 on copyright, and must include the following metadata: subject: glacier and valley/mountain group of reference; full name of the photographer; year the photo was taken; and full name of the owner or archive from which the photo originates
License: All rights reserved
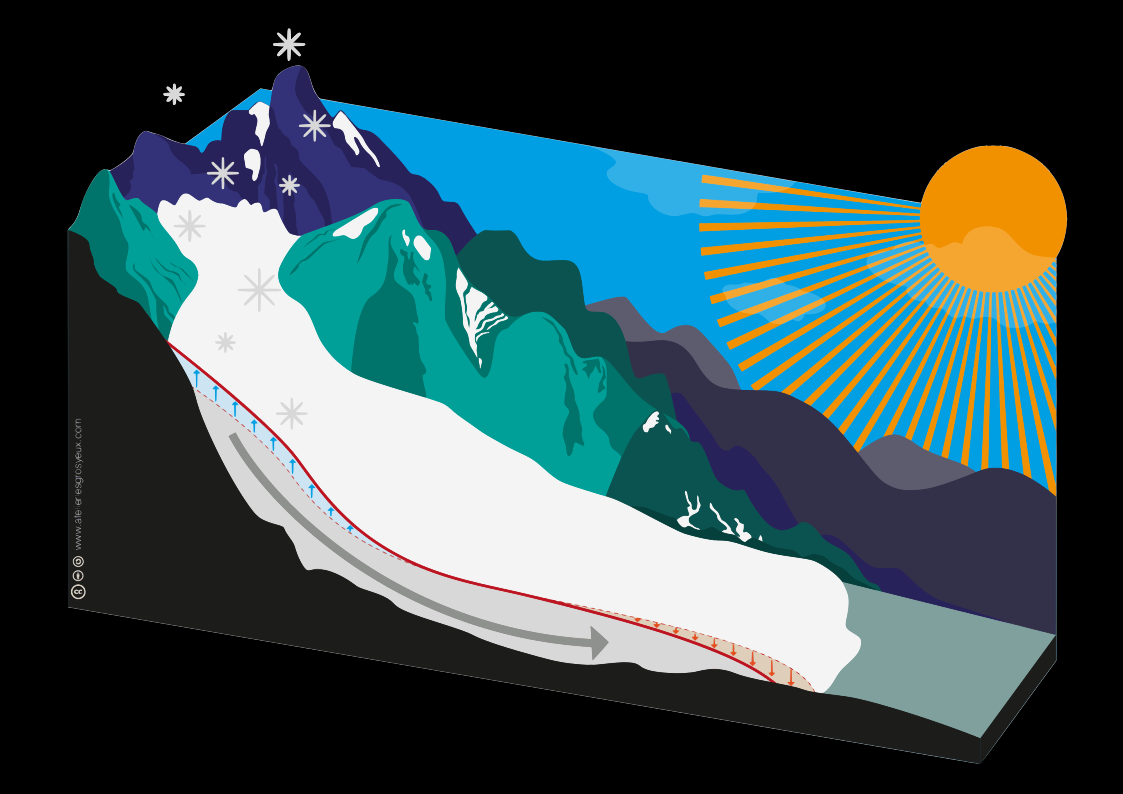
Photographer: Anne Maussion
Date: 2100
Original URL: https://edu.oggm.org/en/latest/glacier_basics.html
License: CC BY-SA 4.0
Date: 2100
Original URL: https://edu.oggm.org/en/latest/glacier_basics.html
License: CC BY-SA 4.0
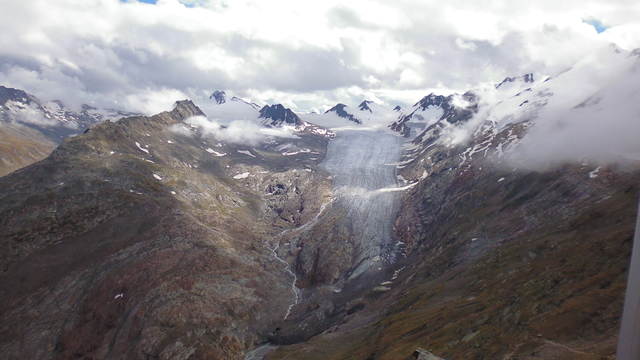
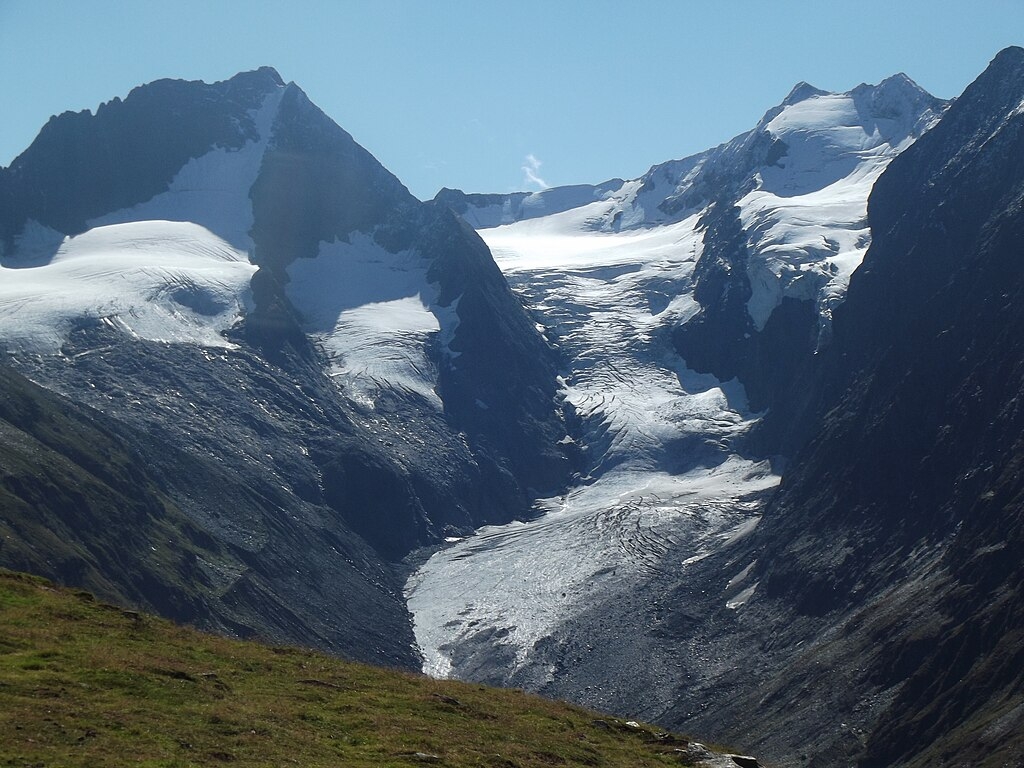
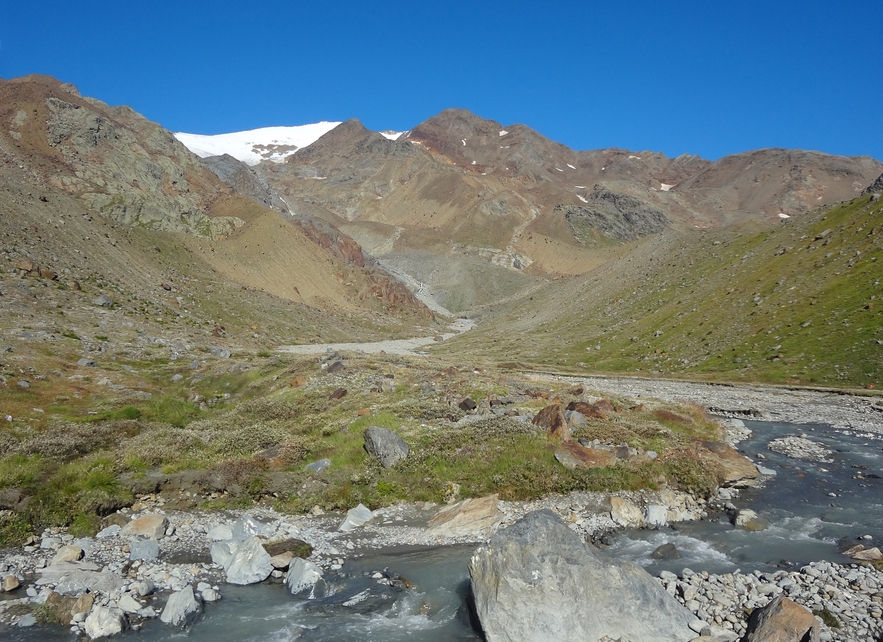
Photographer: Schallhart, N.W.H.
Date: 21.09.2014
Original URL: https://nsidc.org/data/glacier_photo/search/image_info/gurgler-20140921-schallhart
Citation: Schallhart, N.W.H.. 2014. Gurgler Glacier: From the Glacier Photograph Collection. Boulder, Colorado USA: National Snow and Ice Data Center. Digital media.
License: All rights reserved
Photographer: Lambrecht A.
Date: 12.09.2006
Original URL: http://nsidc.org/data/glacier_photo/search/image_info/hintereisferner20060912
Citation: Lambrecht, A.. 2006. Hintereis Ferner Glacier: From the Glacier Photograph Collection. Boulder, Colorado USA: National Snow and Ice Data Center. Digital media.
License: All rights reserved
Photographer: Rainer Prinz
Date: 08.09.2014
Original URL: http://nsidc.org/data/glacier_photo/search/image_info/hintereisferner20140908
Citation: Prinz, Rainer. 2014. Hintereis Ferner Glacier: From the Glacier Photograph Collection. Boulder, Colorado USA: National Snow and Ice Data Center. Digital media.
License: All rights reserved
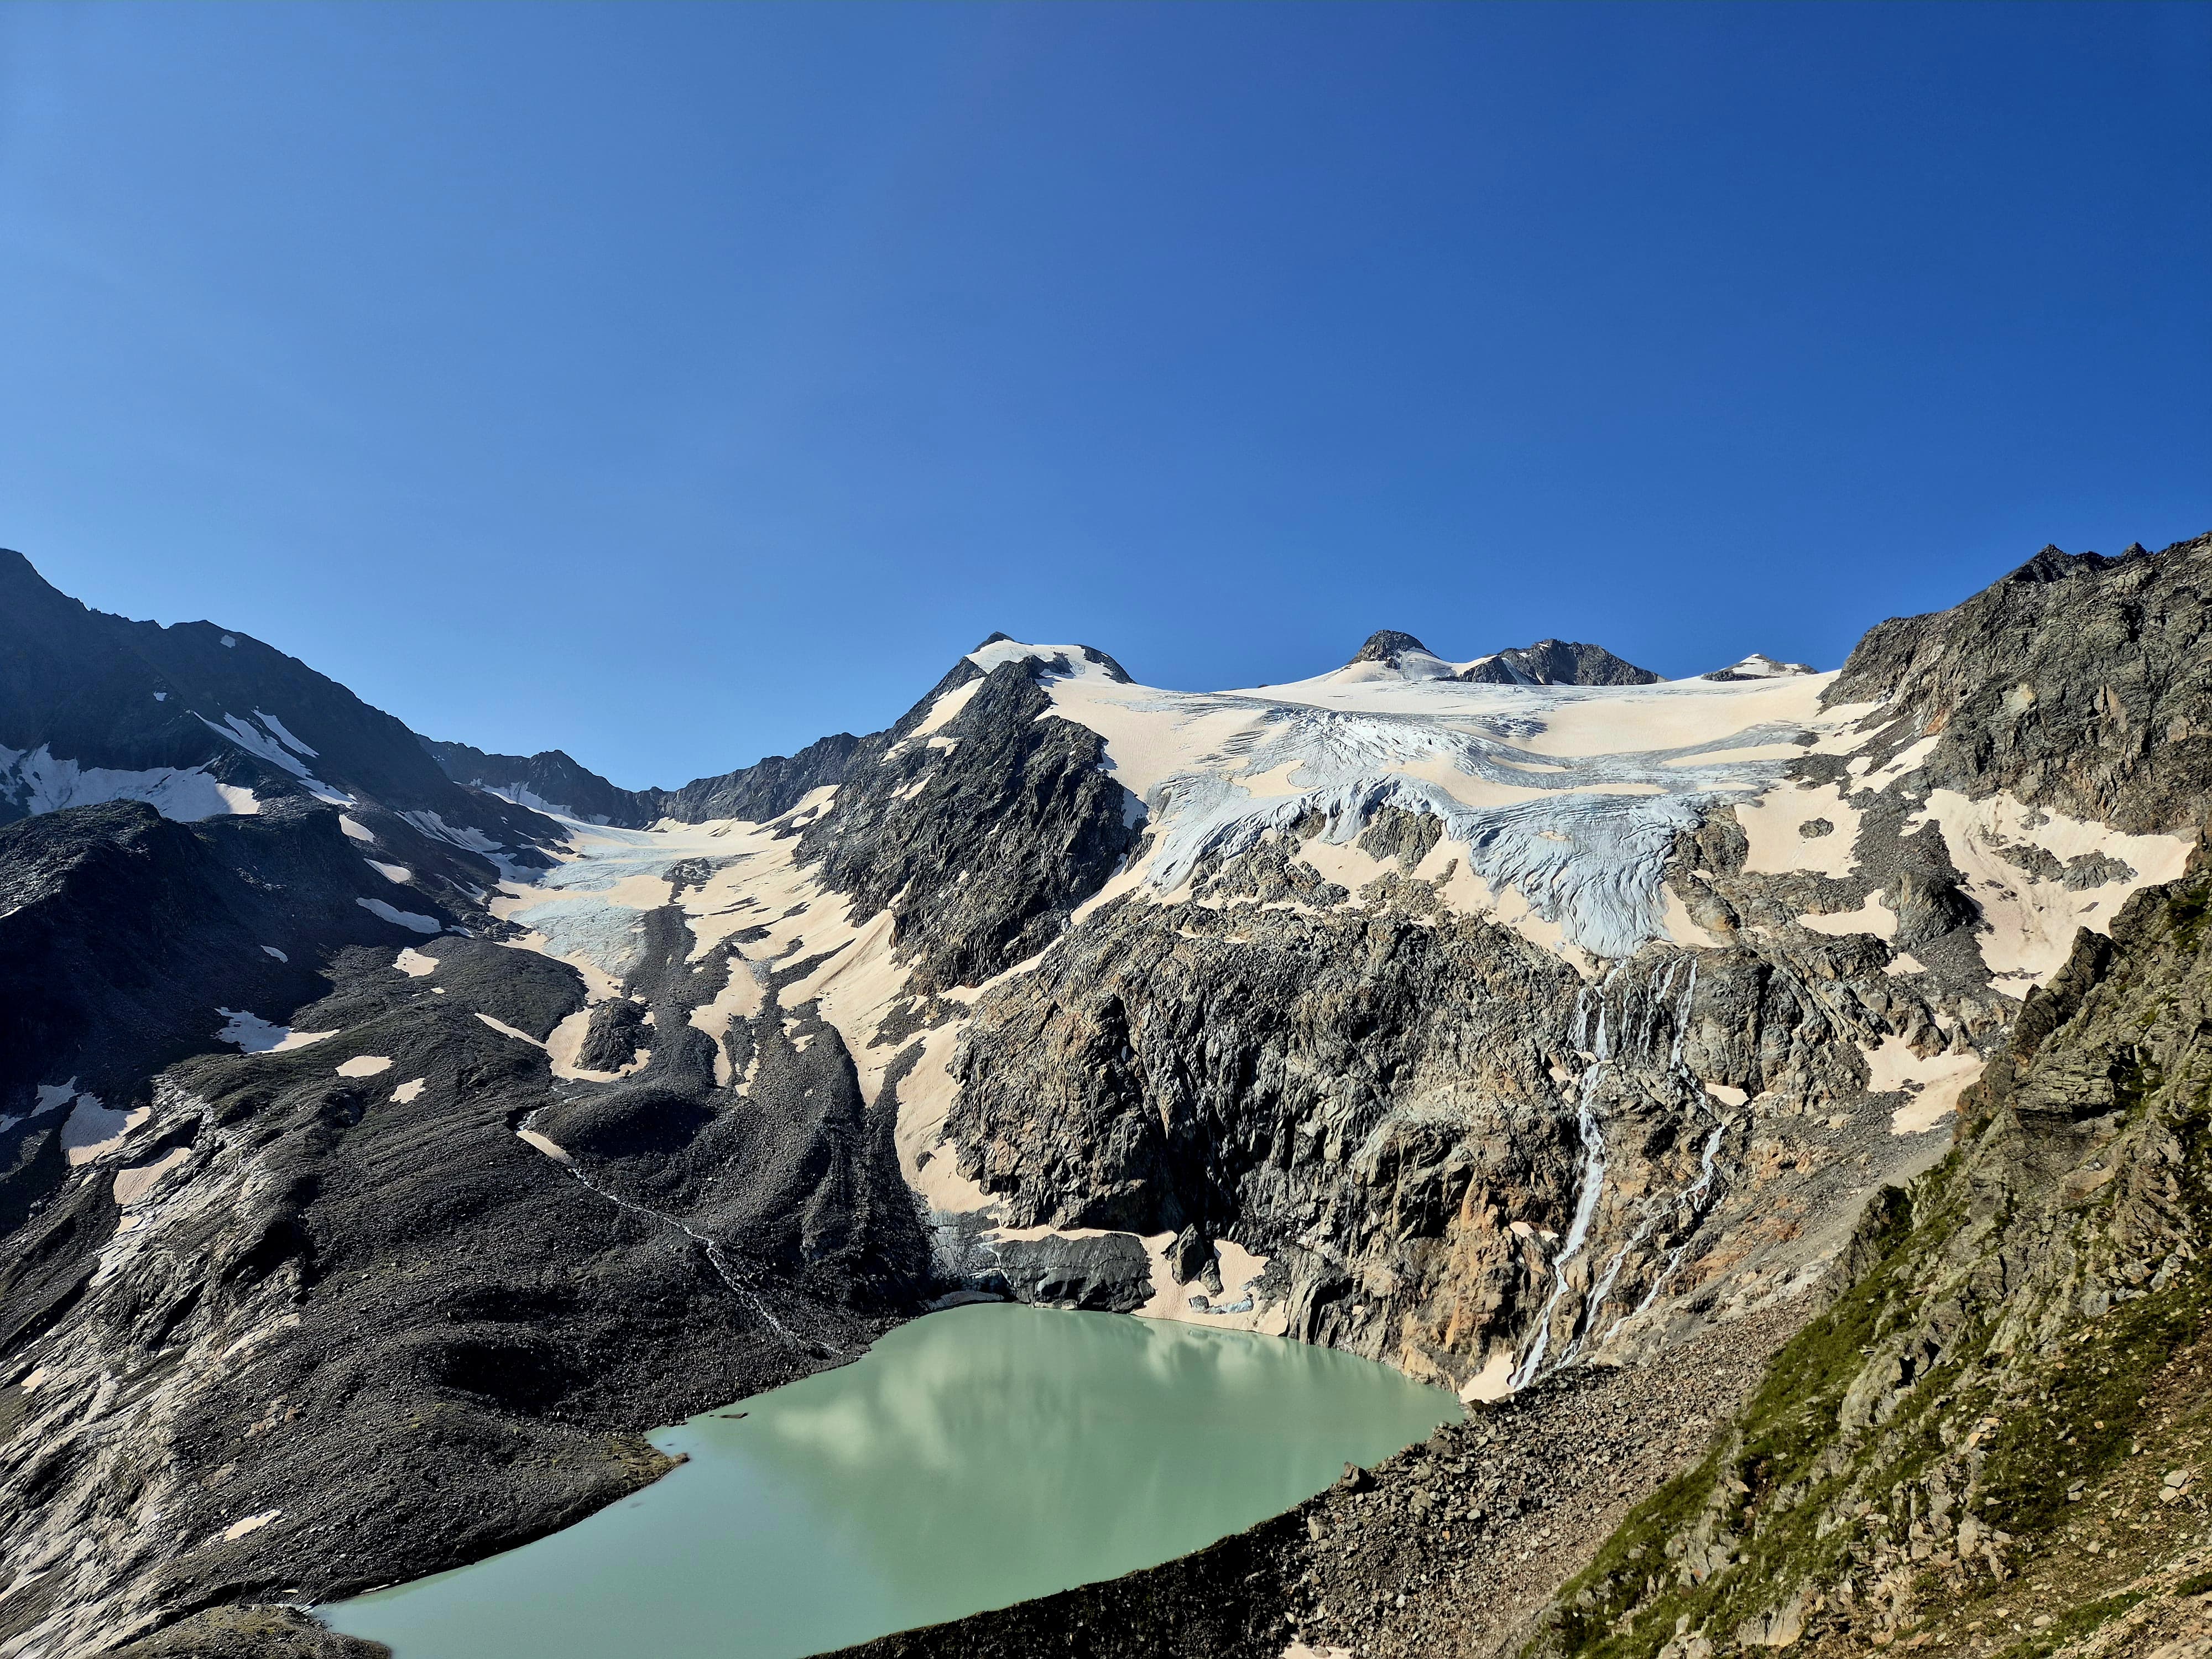
Photographer: Glaus, Ladina
Date: 14.07.2014
Original URL: https://nsidc.org/data/glacier_photo/search/image_info/stein2014071403
Citation: Glaus, Ladina. 2014. Stein Glacier: From the Glacier Photograph Collection. Boulder, Colorado USA: National Snow and Ice Data Center. Digital media.
License: All rights reserved
Date: 14.07.2014
Original URL: https://nsidc.org/data/glacier_photo/search/image_info/stein2014071403
Citation: Glaus, Ladina. 2014. Stein Glacier: From the Glacier Photograph Collection. Boulder, Colorado USA: National Snow and Ice Data Center. Digital media.
License: All rights reserved
Photographer: Romeo Walser
Date: 08.10.2018
Original URL: https://commons.wikimedia.org/wiki/File:Rhonegletscher_Sept-2018a.jpg
License: CC BY-SA 4.0
Date: 08.10.2018
Original URL: https://commons.wikimedia.org/wiki/File:Rhonegletscher_Sept-2018a.jpg
License: CC BY-SA 4.0
Photographer: Jacquemart, Mylene
Date: 18.10.2014
Original URL: https://nsidc.org/data/glacier_photo/search/image_info/eiger2014101803
Citation: Jacquemart, Mylene. 2014. Eiger Glacier: From the Glacier Photograph Collection. Boulder, Colorado USA: National Snow and Ice Data Center. Digital media.
License: All rights reserved
Date: 18.10.2014
Original URL: https://nsidc.org/data/glacier_photo/search/image_info/eiger2014101803
Citation: Jacquemart, Mylene. 2014. Eiger Glacier: From the Glacier Photograph Collection. Boulder, Colorado USA: National Snow and Ice Data Center. Digital media.
License: All rights reserved
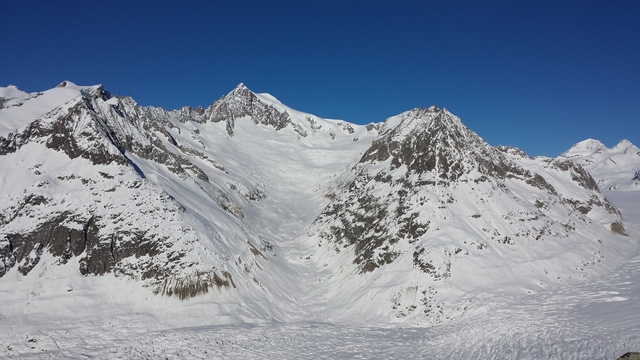
Photographer: Glaus, Ladina
Date: 28.08.2014
Original URL: https://nsidc.org/data/glacier_photo/search/image_info/grosseraletsch2014082803
Citation: Glaus, Ladina. 2014. Grosser Aletsch Glacier: From the Glacier Photograph Collection. Boulder, Colorado USA: National Snow and Ice Data Center. Digital media.
License: All rights reserved
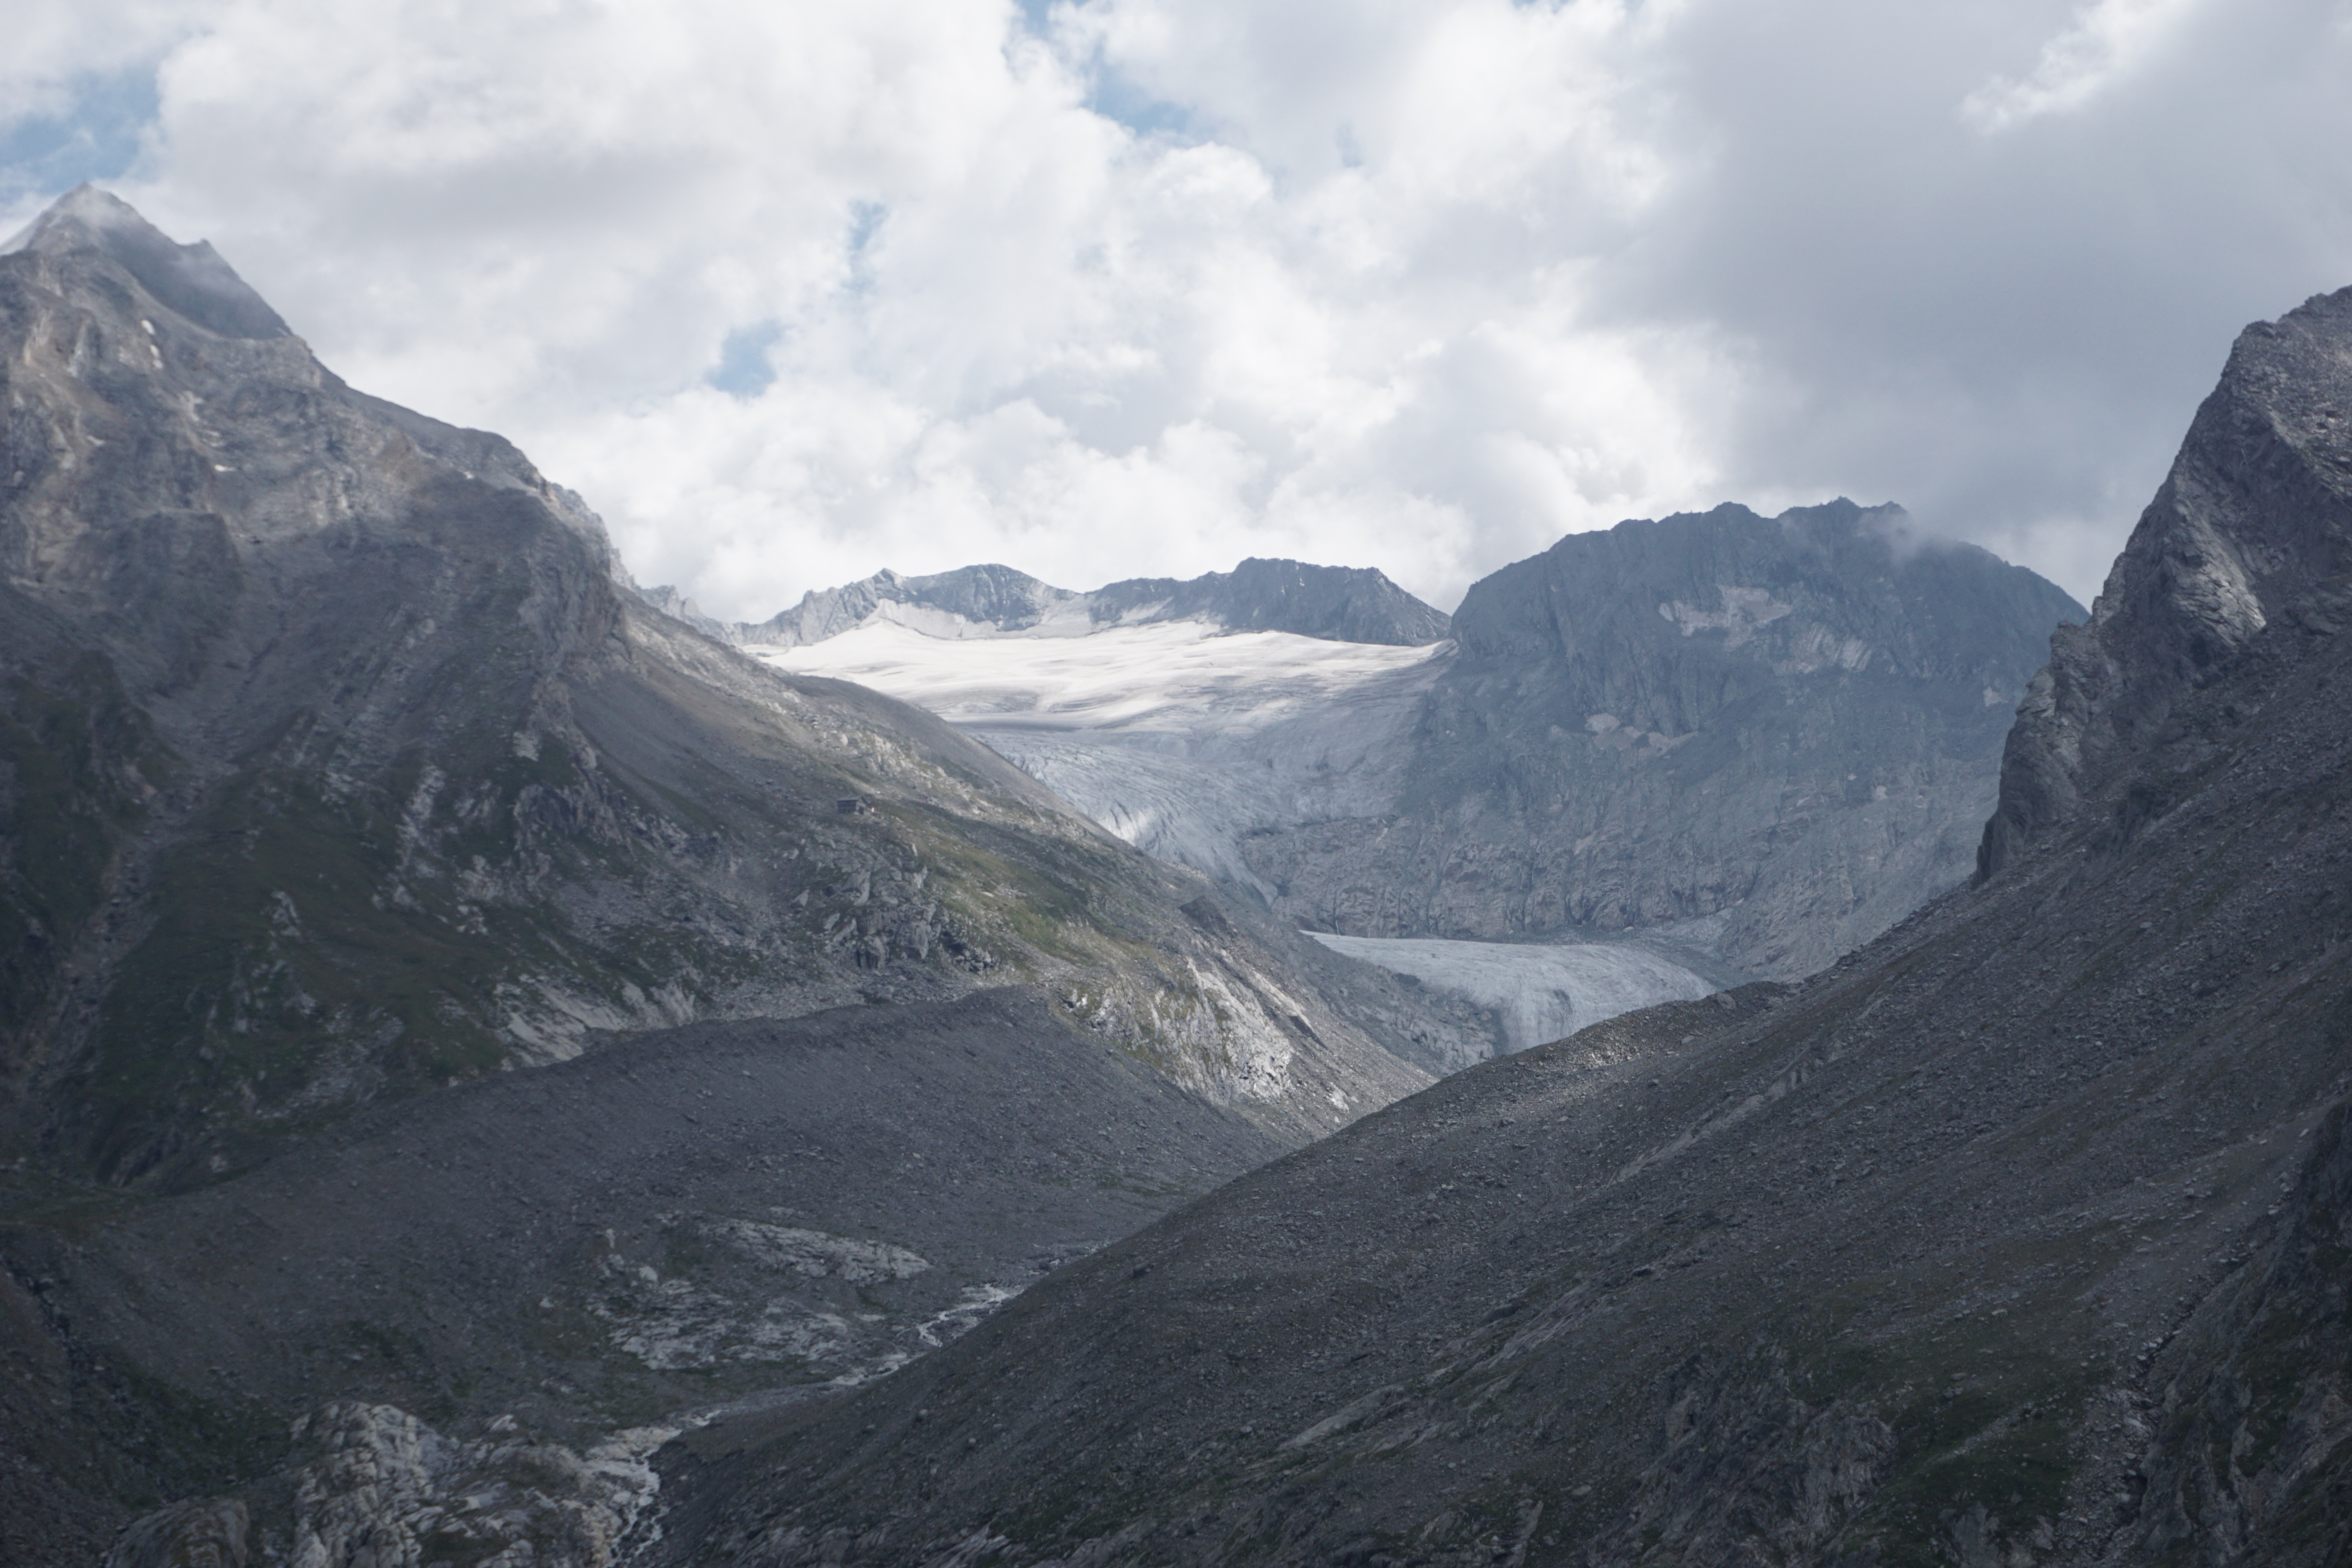
Photographer: Funk, Martin
Date: 21.07.2004
Original URL: https://nsidc.org/data/glacier_photo/search/image_info/fiescher20040721
Citation: Funk, Martin. 2004. Fiescher Glacier: From the Glacier Photograph Collection. Boulder, Colorado USA: National Snow and Ice Data Center. Digital media.
License: All rights reserved
Date: 21.07.2004
Original URL: https://nsidc.org/data/glacier_photo/search/image_info/fiescher20040721
Citation: Funk, Martin. 2004. Fiescher Glacier: From the Glacier Photograph Collection. Boulder, Colorado USA: National Snow and Ice Data Center. Digital media.
License: All rights reserved
Photographer: Michael Zemp
Date: 28.09.2013
Original URL: https://nsidc.org/data/glacier_photo/search/image_info/oberaar2013092801
Citation: Zemp, Michael. 2013. Oberaar Glacier: From the Glacier Photograph Collection. Boulder, Colorado USA: National Snow and Ice Data Center. Digital media.
License: All rights reserved
Date: 28.09.2013
Original URL: https://nsidc.org/data/glacier_photo/search/image_info/oberaar2013092801
Citation: Zemp, Michael. 2013. Oberaar Glacier: From the Glacier Photograph Collection. Boulder, Colorado USA: National Snow and Ice Data Center. Digital media.
License: All rights reserved
Photographer: Christoph Oberschmied
Date: 2022
Citation: Archiv: Agentur für Bevölkerungsschutz
License: All rights reserved
Date: 2022
Citation: Archiv: Agentur für Bevölkerungsschutz
License: All rights reserved
Photographer: Jürgen Merz
Date: 2024
Original URL: https://www.abstract-landscape.com/
License: All rights reserved
Date: 2024
Original URL: https://www.abstract-landscape.com/
License: All rights reserved
Photographer: Jürgen Merz
Date: 2023
Original URL: https://www.abstract-landscape.com/
License: All rights reserved
Date: 2023
Original URL: https://www.abstract-landscape.com/
License: All rights reserved
Photographer: Ambroix
Date: 29.08.2008
Original URL: https://commons.wikimedia.org/wiki/File:Tschingelfirn.jpg
License: public domain
Date: 29.08.2008
Original URL: https://commons.wikimedia.org/wiki/File:Tschingelfirn.jpg
License: public domain
Photographer: Zemp, Michael
Date: 12.02.2015
Original URL: https://nsidc.org/data/glacier_photo/search/image_info/mittelaletsch20150212
Citation: Zemp, Michael. 2015. Mittelaletsch Glacier: From the Glacier Photograph Collection. Boulder, Colorado USA: National Snow and Ice Data Center. Digital media.
License: All rights reserved
Photographer: Ste Valentini
Date: 16.08.2011
Original URL: https://commons.wikimedia.org/wiki/File:Ghiacciaio_del_Careser.jpg
License: CC BY-SA 3.0
Date: 16.08.2011
Original URL: https://commons.wikimedia.org/wiki/File:Ghiacciaio_del_Careser.jpg
License: CC BY-SA 3.0
Photographer: Christian Casarotto (MUSE)
Date: 2024
Copyright: By downloading the images, the user declares that the use of the photos is authorized in compliance with Directive (EU) 2019/790 on copyright, and must include the following metadata: subject: glacier and valley/mountain group of reference; full name of the photographer; year the photo was taken; and full name of the owner or archive from which the photo originates
License: All rights reserved
Photographer: Jacquemart, Mylene
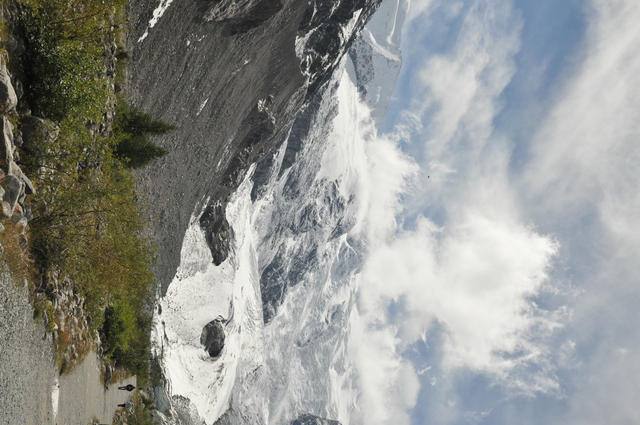
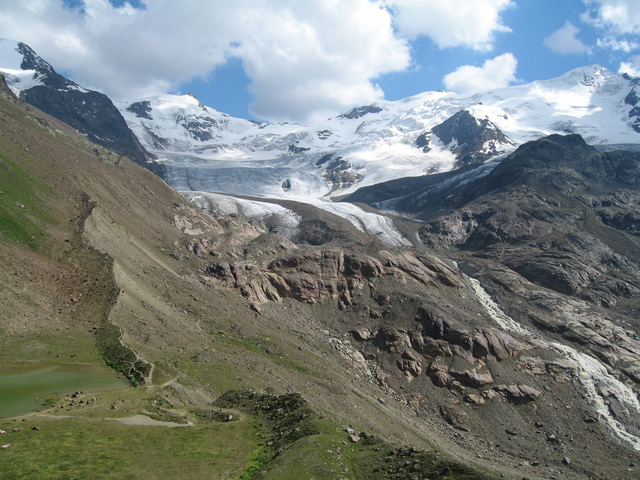
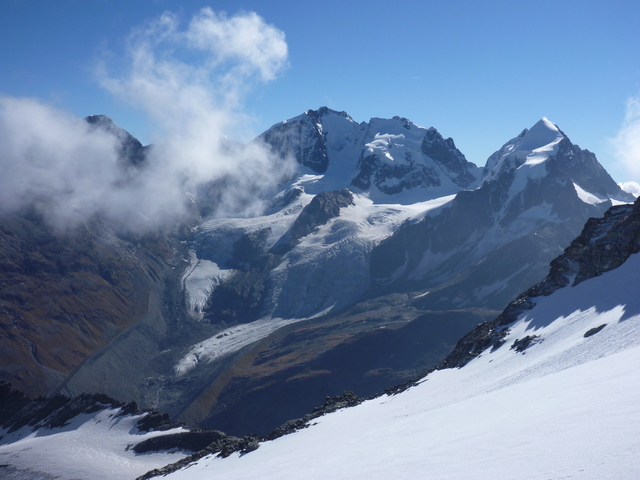
Date: 02.09.2012
Original URL: https://nsidc.org/data/glacier_photo/search/image_info/morteratsch2012090205
Citation: Jacquemart, Mylene. 2012. Morteratsch Glacier: From the Glacier Photograph Collection. Boulder, Colorado USA: National Snow and Ice Data Center. Digital media.
License: All rights reserved
Photographer: Hambrey, Michael
Date: 07.2007
Original URL: https://nsidc.org/data/glacier_photo/search/image_info/forni20070799
Citation: Hambrey, Michael. 2007. Forni Glacier: From the Glacier Photograph Collection. Boulder, Colorado USA: National Snow and Ice Data Center. Digital media.
License: All rights reserved
Date: 07.2007
Original URL: https://nsidc.org/data/glacier_photo/search/image_info/forni20070799
Citation: Hambrey, Michael. 2007. Forni Glacier: From the Glacier Photograph Collection. Boulder, Colorado USA: National Snow and Ice Data Center. Digital media.
License: All rights reserved
Photographer: Fischer, Mauro
Date: 04.10.2014
Original URL: https://nsidc.org/data/glacier_photo/search/image_info/tschierva2014100402
Citation: Fischer, Mauro. 2014. Tschierva Glacier: From the Glacier Photograph Collection. Boulder, Colorado USA: National Snow and Ice Data Center. Digital media.
License: All rights reserved
Date: 04.10.2014
Original URL: https://nsidc.org/data/glacier_photo/search/image_info/tschierva2014100402
Citation: Fischer, Mauro. 2014. Tschierva Glacier: From the Glacier Photograph Collection. Boulder, Colorado USA: National Snow and Ice Data Center. Digital media.
License: All rights reserved
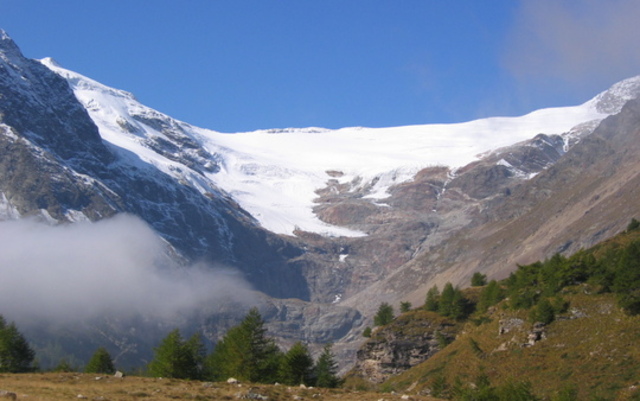
Photographer: Usselmann, S.
Date: 28.09.2008
Original URL: https://nsidc.org/data/glacier_photo/search/image_info/palue20080928
Citation: Usselmann, S.. 2008. Palue Glacier: From the Glacier Photograph Collection. Boulder, Colorado USA: National Snow and Ice Data Center. Digital media.
License: All rights reserved
Date: 28.09.2008
Original URL: https://nsidc.org/data/glacier_photo/search/image_info/palue20080928
Citation: Usselmann, S.. 2008. Palue Glacier: From the Glacier Photograph Collection. Boulder, Colorado USA: National Snow and Ice Data Center. Digital media.
License: All rights reserved
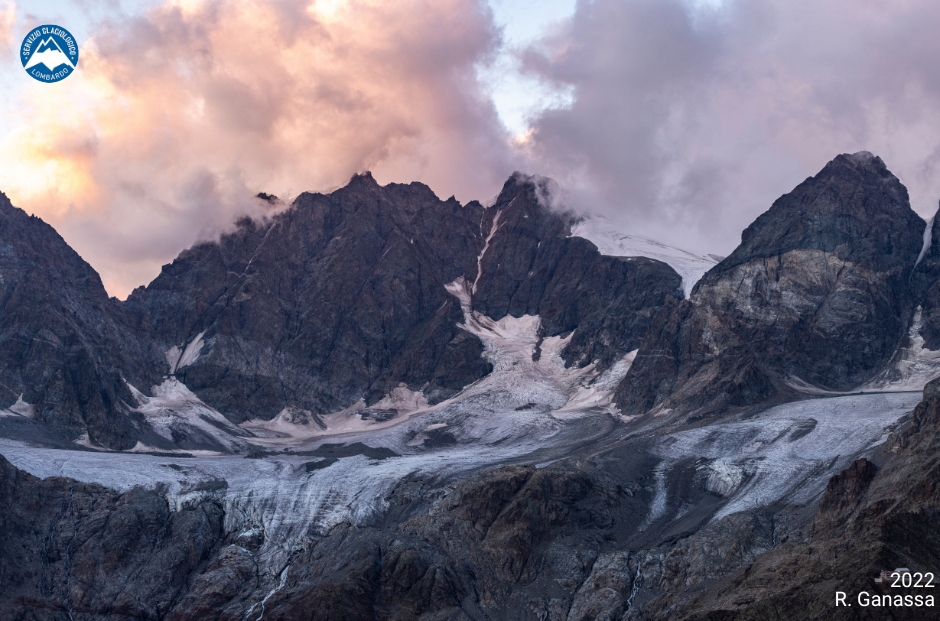
Photographer: R. Ganassa
Date: 2022
Original URL: https://www.servizioglaciologicolombardo.it/confronti-fotografici/
License: All rights reserved
Date: 2022
Original URL: https://www.servizioglaciologicolombardo.it/confronti-fotografici/
License: All rights reserved
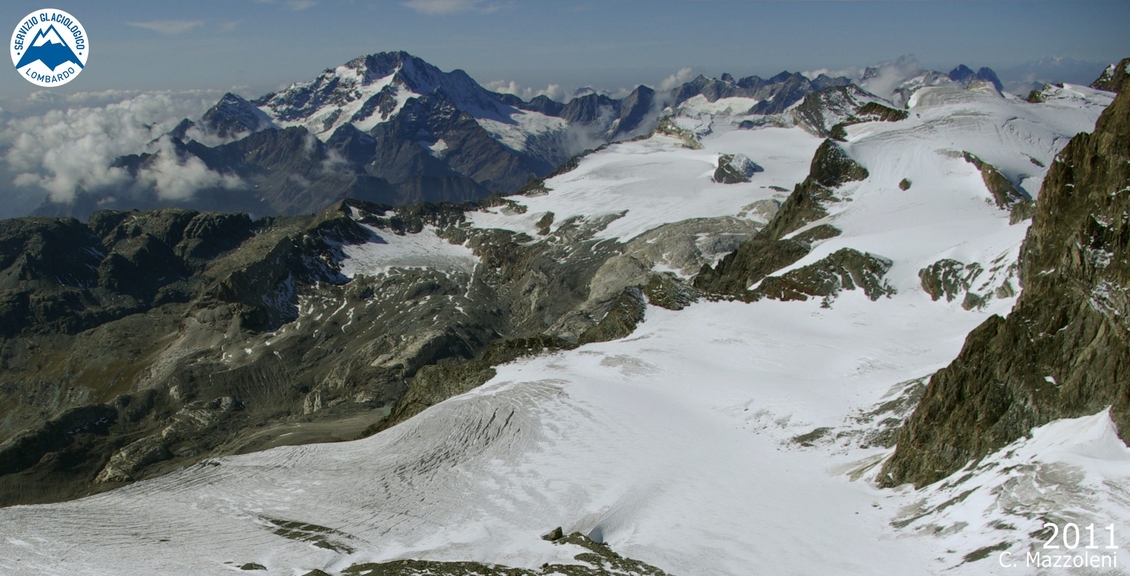
Photographer: C. Mazzoleni
Date: 2011
Original URL: https://www.servizioglaciologicolombardo.it/confronti-fotografici/
License: All rights reserved
Date: 2011
Original URL: https://www.servizioglaciologicolombardo.it/confronti-fotografici/
License: All rights reserved
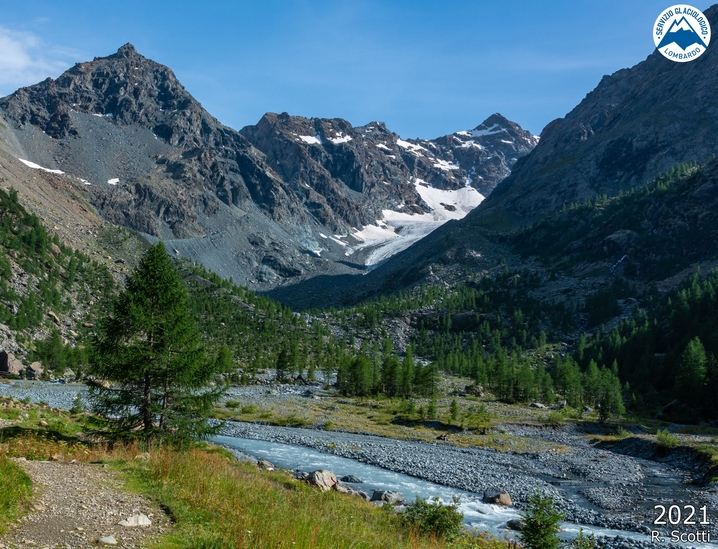
Photographer: R. Scotti
Date: 2021
Original URL: https://www.servizioglaciologicolombardo.it/confronti-fotografici/
License: All rights reserved
Date: 2021
Original URL: https://www.servizioglaciologicolombardo.it/confronti-fotografici/
License: All rights reserved
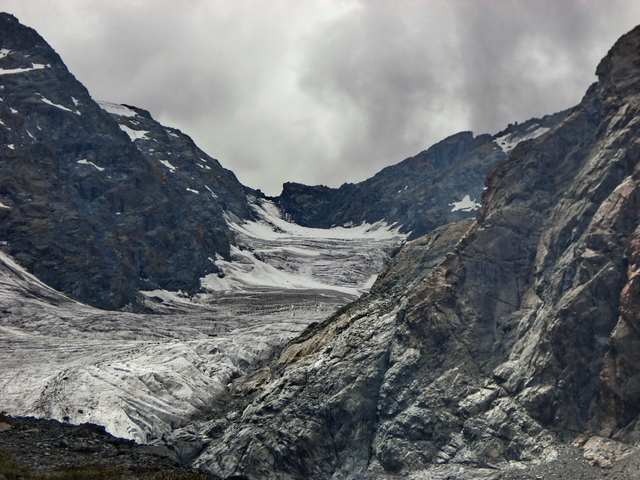
Photographer: Steiner, Christian
Date: 13.08.2007
Original URL: https://nsidc.org/data/glacier_photo/search/image_info/ventina2007081302
Citation: Steiner, Christian. 2007. Ventina Glacier: From the Glacier Photograph Collection. Boulder, Colorado USA: National Snow and Ice Data Center. Digital media.
License: All rights reserved
Date: 13.08.2007
Original URL: https://nsidc.org/data/glacier_photo/search/image_info/ventina2007081302
Citation: Steiner, Christian. 2007. Ventina Glacier: From the Glacier Photograph Collection. Boulder, Colorado USA: National Snow and Ice Data Center. Digital media.
License: All rights reserved
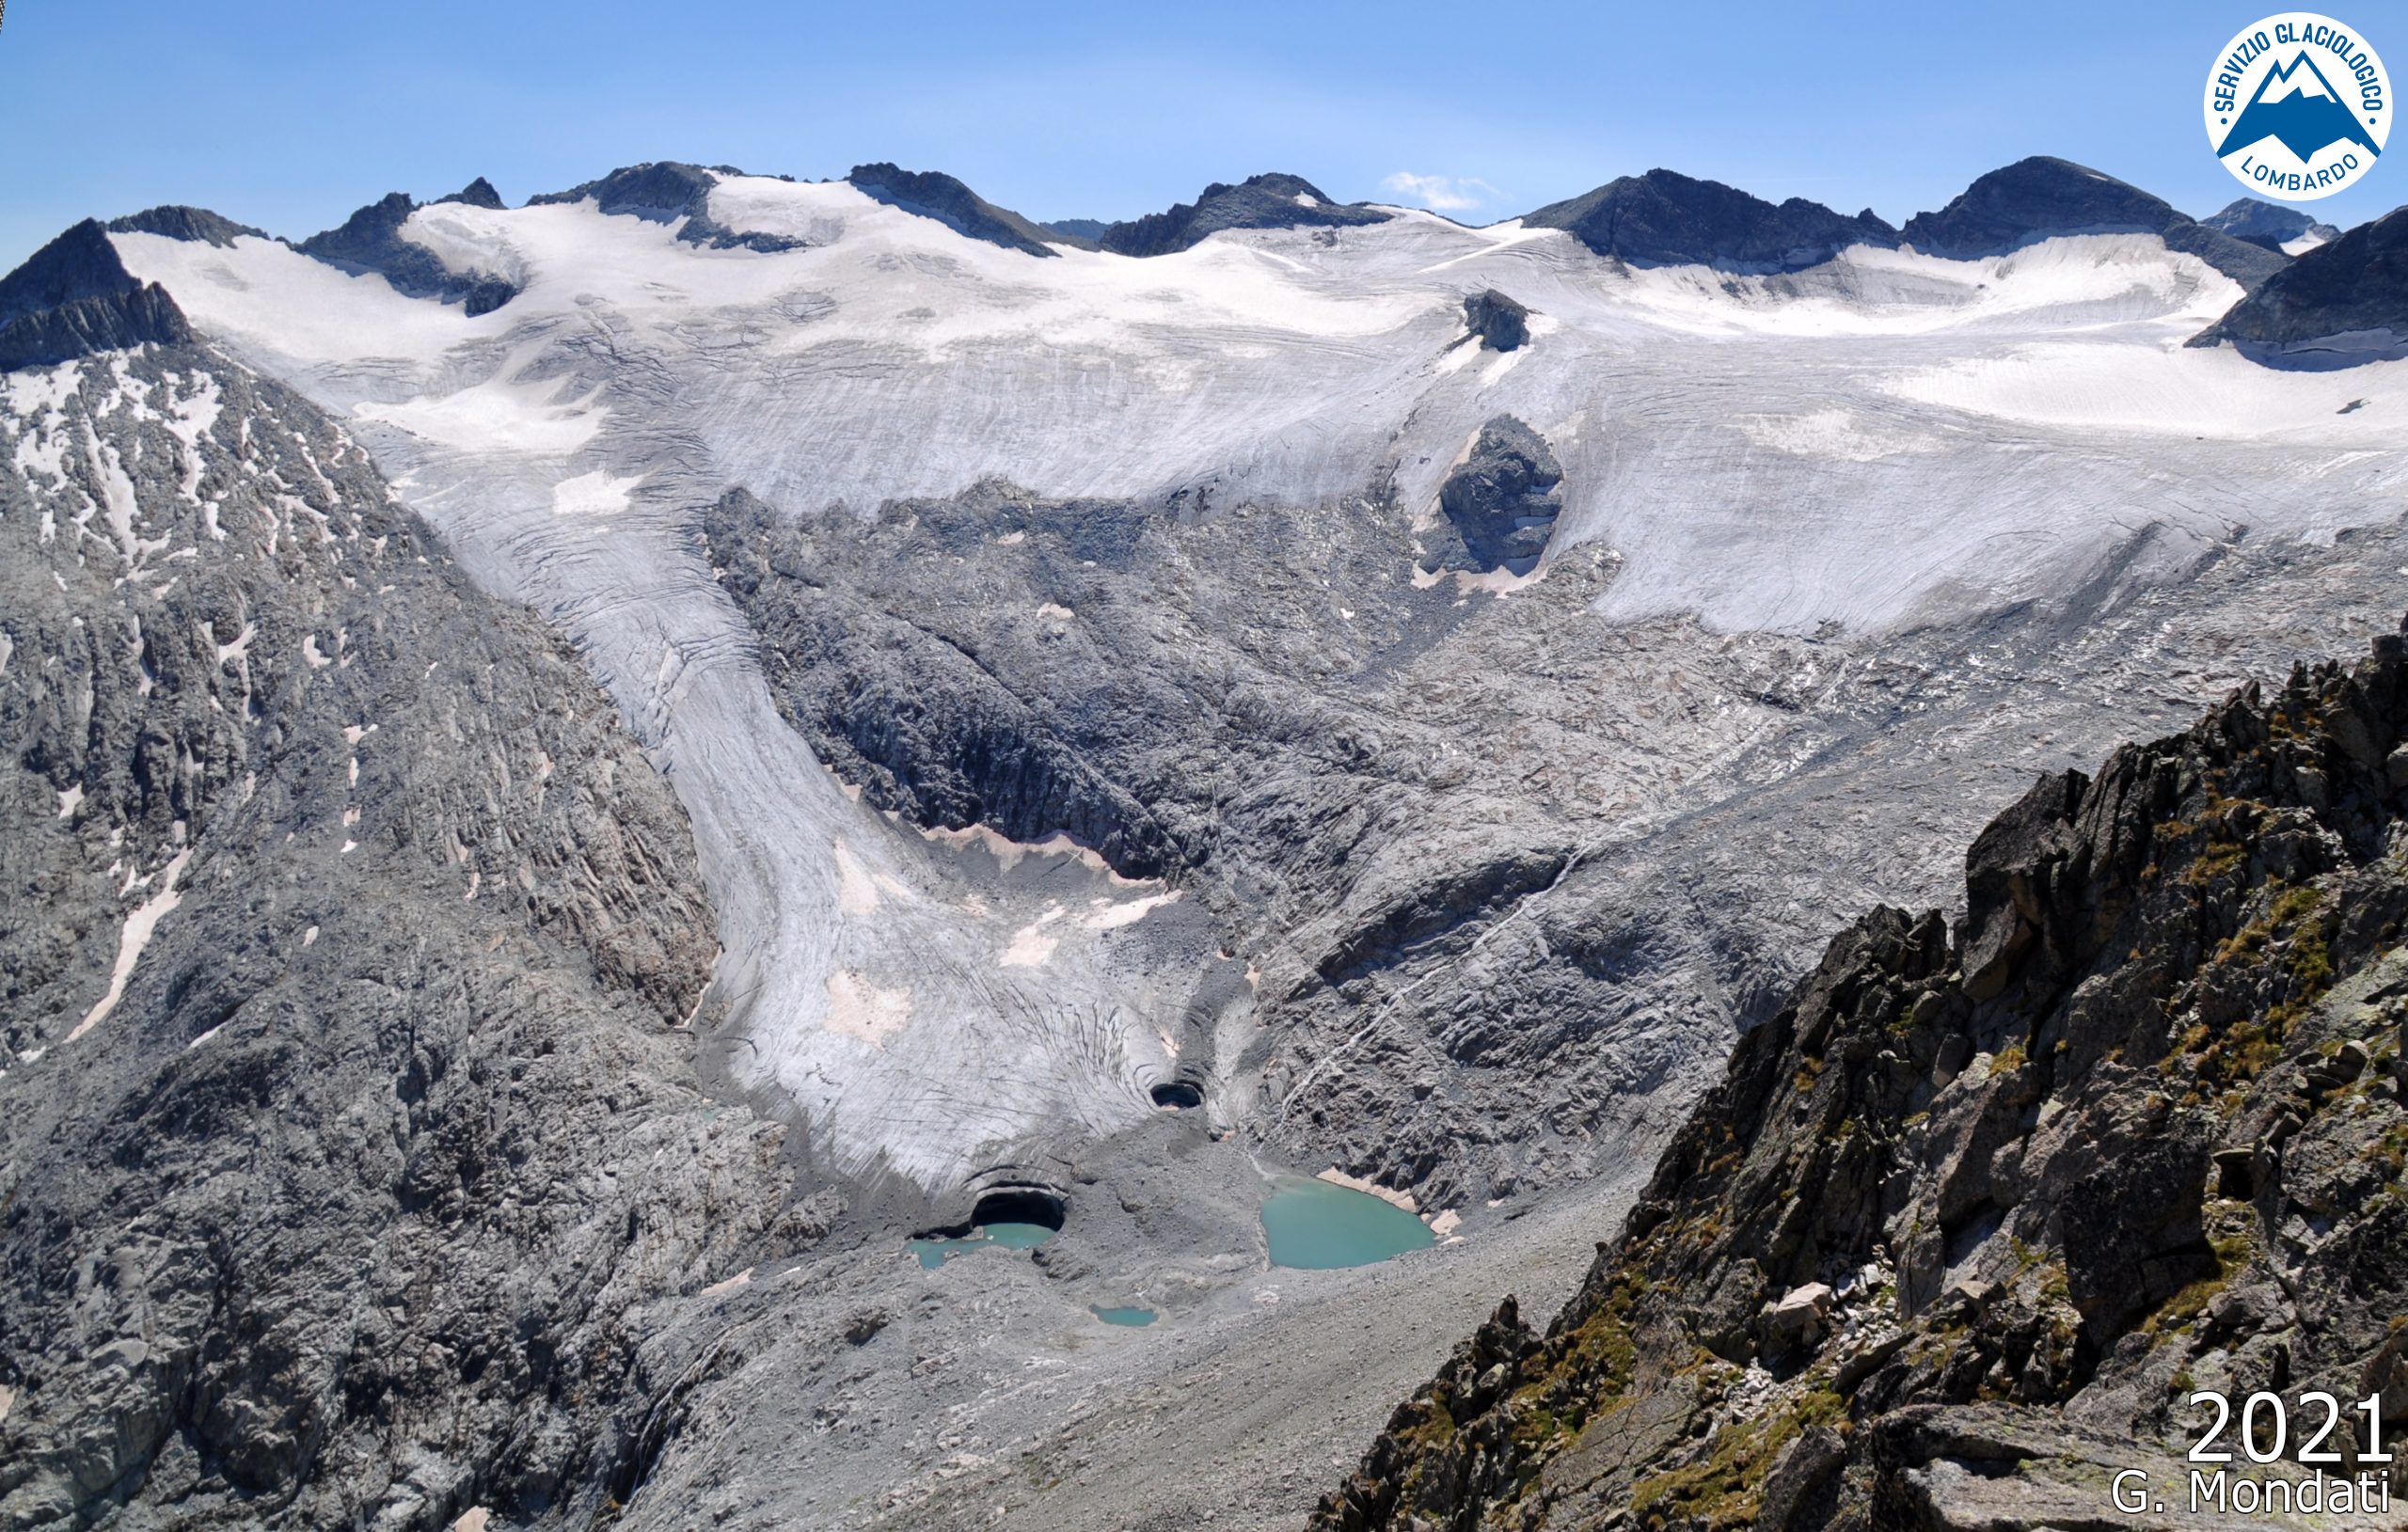
Photographer: G. Mondati
Date: 2021
Original URL: https://www.servizioglaciologicolombardo.it/confronti-fotografici/
License: All rights reserved
Date: 2021
Original URL: https://www.servizioglaciologicolombardo.it/confronti-fotografici/
License: All rights reserved
Photographer: Tobias Bachmann
Date: 23.06.2019
Original URL: https://nsidc.org/data/glacier_photo/search/image_info/turtmann-20190623-bachmann?order=true
Citation: Bachmann, Tobias. 2019. Turtmann Glacier: From the Glacier Photograph Collection. Boulder, Colorado USA: National Snow and Ice Data Center. Digital media.
License: All rights reserved
Photographer: Morard, Sarah
Date: 30.06.2018
Original URL: https://nsidc.org/data/glacier_photo/search/image_info/montmine-2018063002-morard
Citation: Morard, Sarah. 2018. Mont Mine Glacier: From the Glacier Photograph Collection. Boulder, Colorado USA: National Snow and Ice Data Center. Digital media.
License: All rights reserved
Photographer: Matthias Huss
Date: 24.07.2018
Original URL: https://nsidc.org/data/glacier_photo/search/image_info/findel-20180724-huss?order=true
Citation: Huss, Matthias. 2018. Findelen Glacier: From the Glacier Photograph Collection. Boulder, Colorado USA: National Snow and Ice Data Center. Digital media.
License: All rights reserved
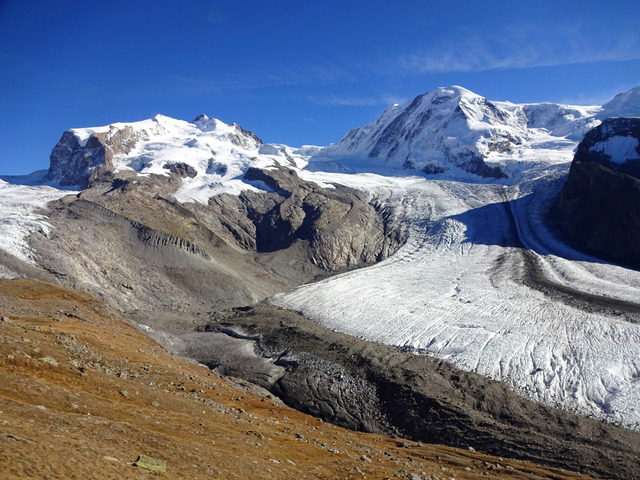
Photographer: Huss, Matthias
Date: 05.10.2017
Original URL: https://nsidc.org/data/glacier_photo/search/image_info/gorner-2017100501-huss
Citation: Huss, Matthias. 2017. Gorner Glacier: From the Glacier Photograph Collection. Boulder, Colorado USA: National Snow and Ice Data Center. Digital media.
License: All rights reserved
Date: 05.10.2017
Original URL: https://nsidc.org/data/glacier_photo/search/image_info/gorner-2017100501-huss
Citation: Huss, Matthias. 2017. Gorner Glacier: From the Glacier Photograph Collection. Boulder, Colorado USA: National Snow and Ice Data Center. Digital media.
License: All rights reserved
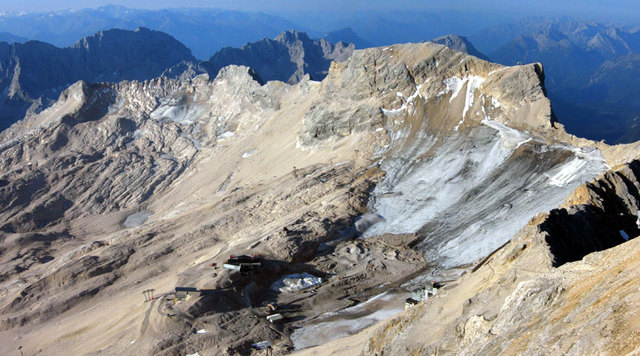
Photographer: Hagg, W.
Date: 09.2006
Original URL: https://nsidc.org/data/glacier_photo/search/image_info/noerdlichschneeferner20060999
Citation: Hagg, W.. 2006. Schneeferner North Glacier: From the Glacier Photograph Collection. Boulder, Colorado USA: National Snow and Ice Data Center. Digital media.
License: All rights reserved
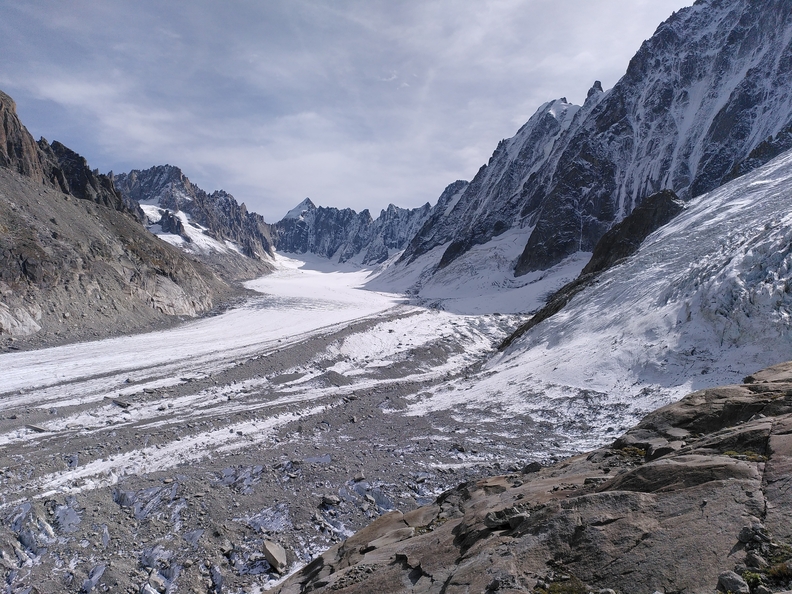
Photographer: Krogh-Pedersen, Bjarne
Date: 17.08.2007
Original URL: https://nsidc.org/data/glacier_photo/search/image_info/merdeglace20070817
Citation: Krogh-Pedersen, Bjarne. 2007. Mer de Glace Glacier: From the Glacier Photograph Collection. Boulder, Colorado USA: National Snow and Ice Data Center. Digital media.
License: All rights reserved

Photographer: Stephan Peccini
Date: 04.09.2014
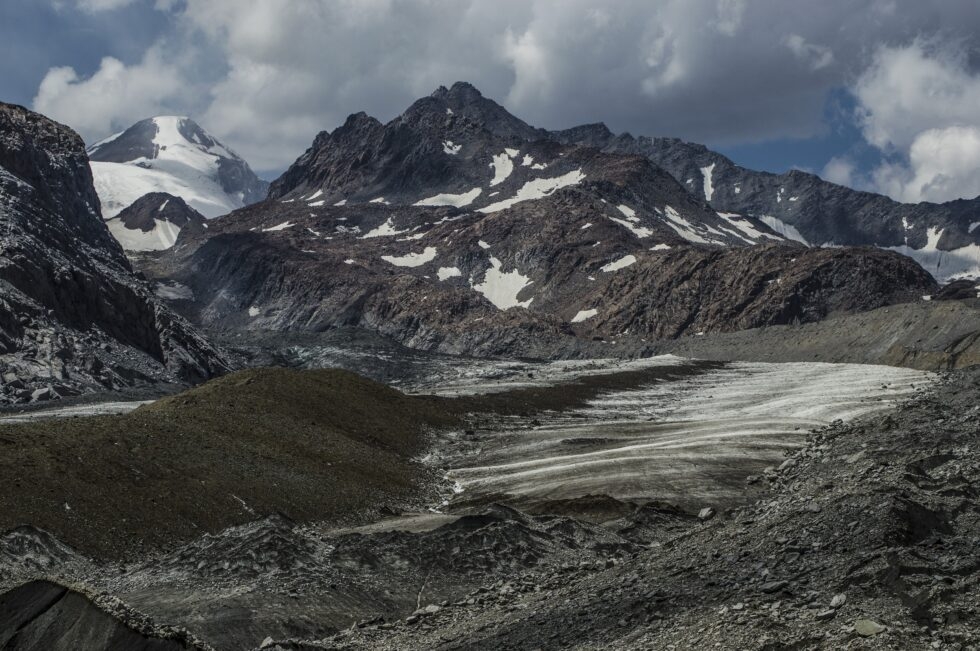
Original URL: http://nsidc.org/data/glacier_photo/search/image_info/gebroulaz2014090402
Citation: Peccini, Stephan. 2014. Gebraoulaz Glacier: From the Glacier Photograph Collection. Boulder, Colorado USA: National Snow and Ice Data Center. Digital media.
License: CC BY-NC-SA 4.0
Date: 04.09.2014
Original URL: http://nsidc.org/data/glacier_photo/search/image_info/gebroulaz2014090402
Citation: Peccini, Stephan. 2014. Gebraoulaz Glacier: From the Glacier Photograph Collection. Boulder, Colorado USA: National Snow and Ice Data Center. Digital media.
License: CC BY-NC-SA 4.0
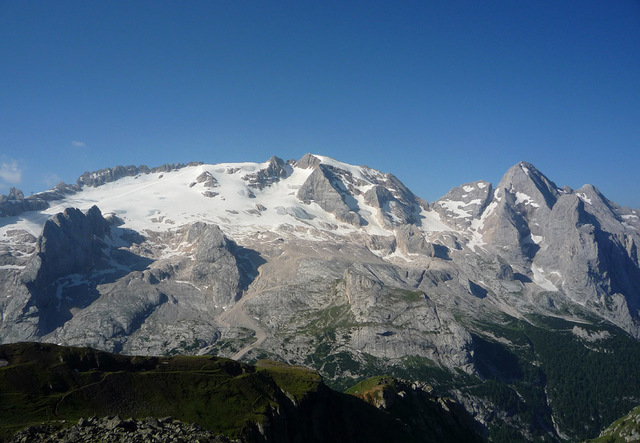
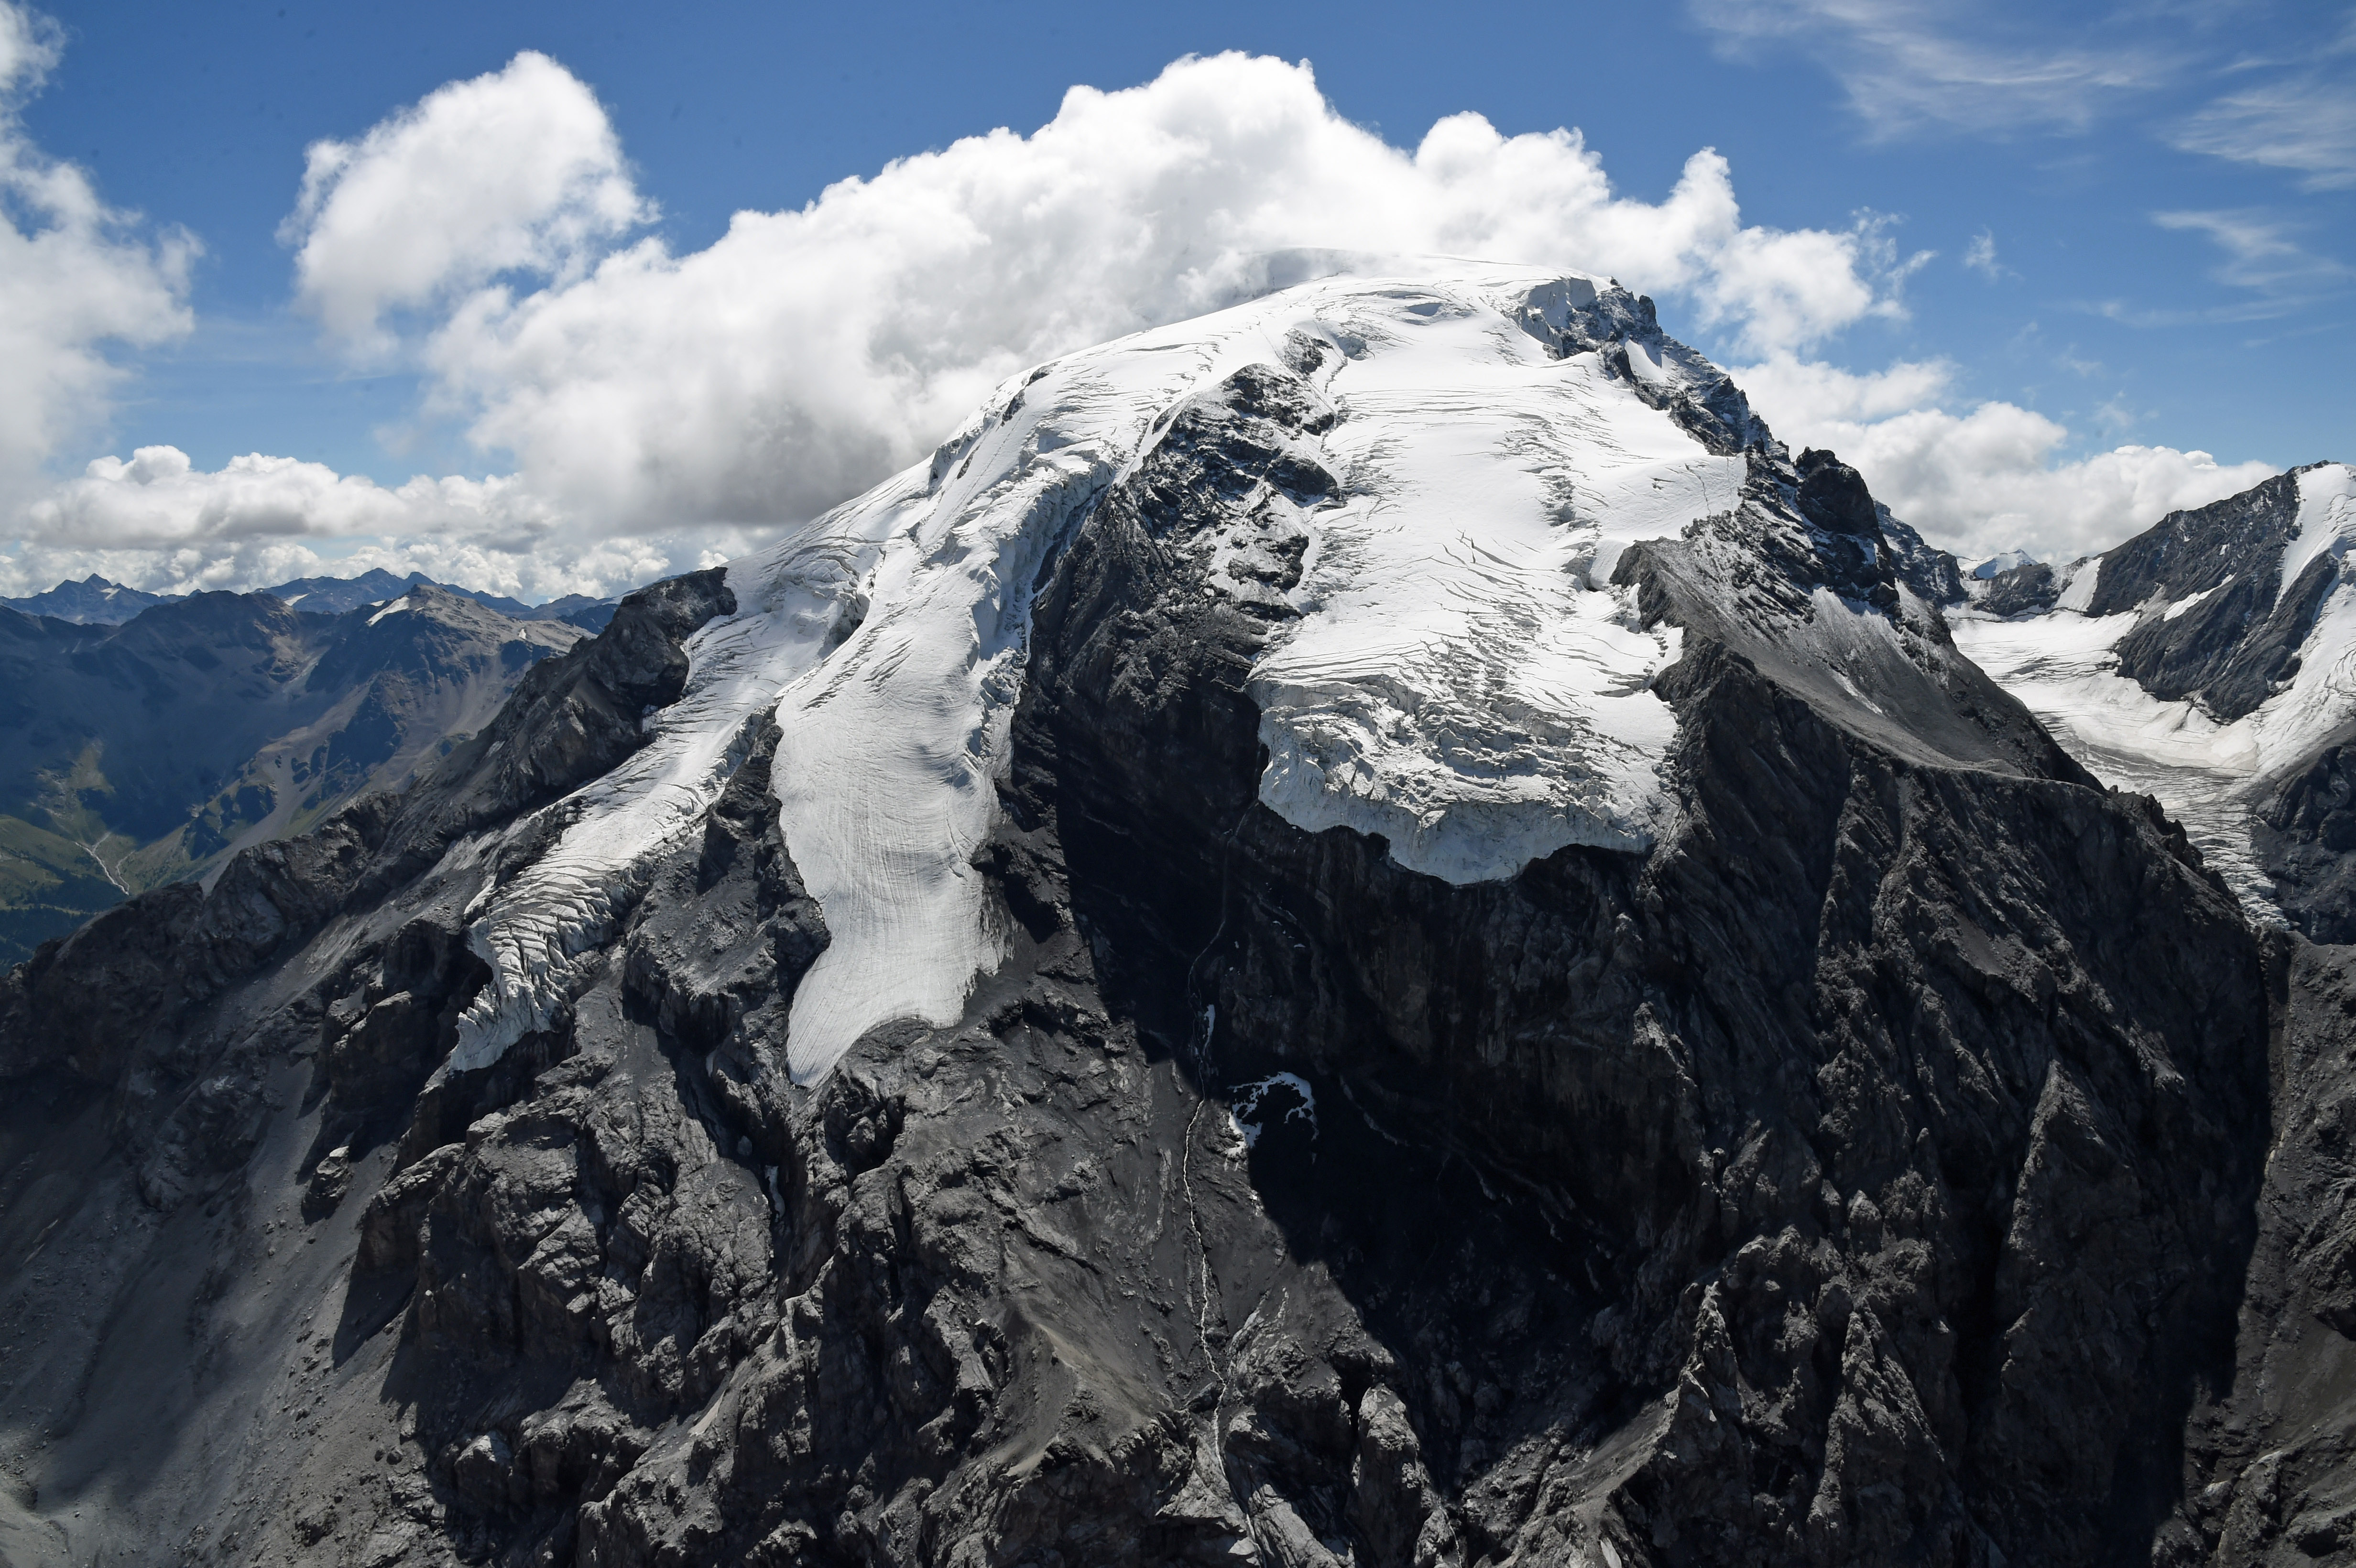
Photographer: Matthias Huss
Date: 24.07.2009
Original URL: http://nsidc.org/data/glacier_photo/search/image_info/marmolada-20090724-huss
Citation: Huss, Matthias. 2009. Marmolada Glacier: From the Glacier Photograph Collection. Boulder, Colorado USA: National Snow and Ice Data Center. Digital media.
License: All rights reserved
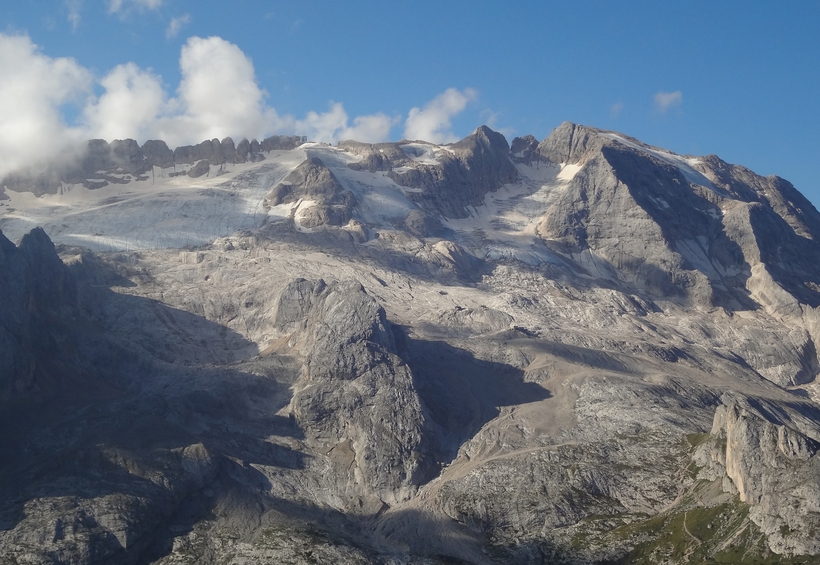
Photographer: Christian Casarotto (MUSE)
Date: 2024
Copyright: By downloading the images, the user declares that the use of the photos is authorized in compliance with Directive (EU) 2019/790 on copyright, and must include the following metadata: subject: glacier and valley/mountain group of reference; full name of the photographer; year the photo was taken; and full name of the owner or archive from which the photo originates
License: All rights reserved
Date: 2024
Copyright: By downloading the images, the user declares that the use of the photos is authorized in compliance with Directive (EU) 2019/790 on copyright, and must include the following metadata: subject: glacier and valley/mountain group of reference; full name of the photographer; year the photo was taken; and full name of the owner or archive from which the photo originates
License: All rights reserved
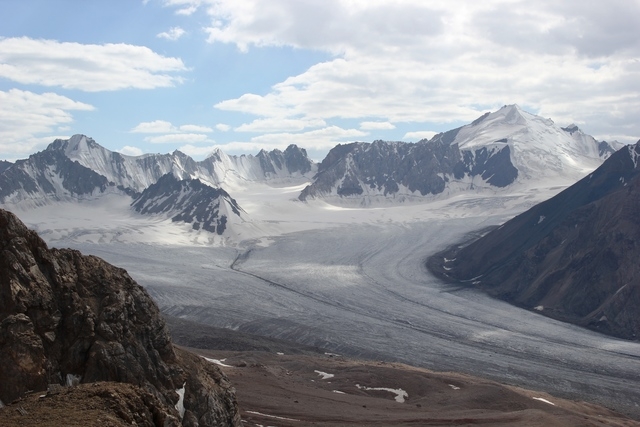
Photographer: Martina Barandun
Date: 2012
Original URL: https://nsidc.org/data/glacier_photo/search/image_info/abramov-20129999-barandun?order=true
Citation: Barandun, Martina. 2012. Abramov Glacier: From the Glacier Photograph Collection. Boulder, Colorado USA: National Snow and Ice Data Center. Digital media.
License: All rights reserved
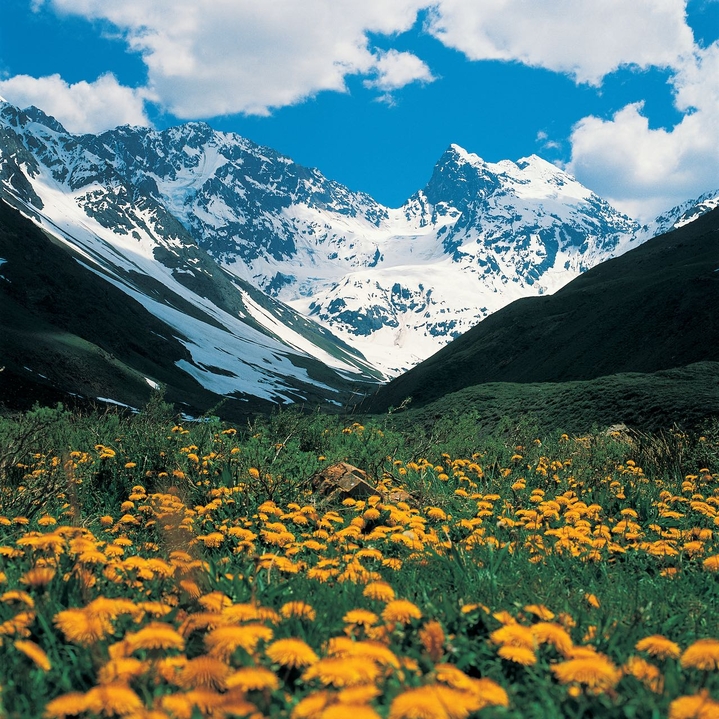
Photographer: Marcos Cole
Date: 10.01.2016
Original URL: https://www.glaciareschilenos.org/en/photography/universidad-glacier/
License: All rights reserved
Date: 10.01.2016
Original URL: https://www.glaciareschilenos.org/en/photography/universidad-glacier/
License: All rights reserved
Photographer: Joaquin Baranao
Date: 08.08.2020
Original URL: https://www.wikiexplora.com/Archivo:Laguna_de_morales_y_cerro_morado.jpeg
License: All rights reserved
Date: 08.08.2020
Original URL: https://www.wikiexplora.com/Archivo:Laguna_de_morales_y_cerro_morado.jpeg
License: All rights reserved
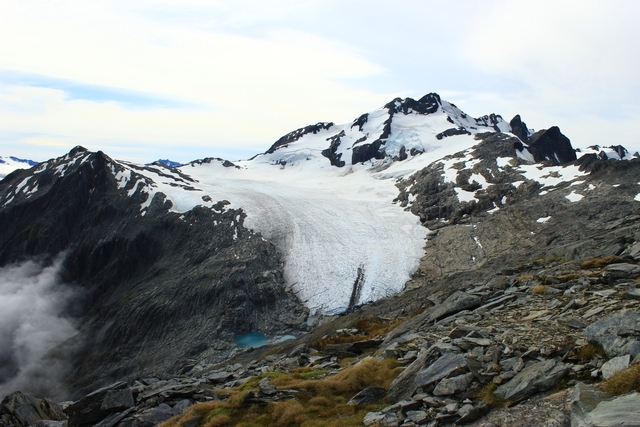
Photographer: Davie-Martin, C.
Date: 20.03.2014
Original URL: https://nsidc.org/data/glacier_photo/search/image_info/brewster20140320
Citation: Davie-Martin, C.. 2014. Brewster Glacier: From the Glacier Photograph Collection. Boulder, Colorado USA: National Snow and Ice Data Center. Digital media.
License: All rights reserved
Date: 20.03.2014
Original URL: https://nsidc.org/data/glacier_photo/search/image_info/brewster20140320
Citation: Davie-Martin, C.. 2014. Brewster Glacier: From the Glacier Photograph Collection. Boulder, Colorado USA: National Snow and Ice Data Center. Digital media.
License: All rights reserved
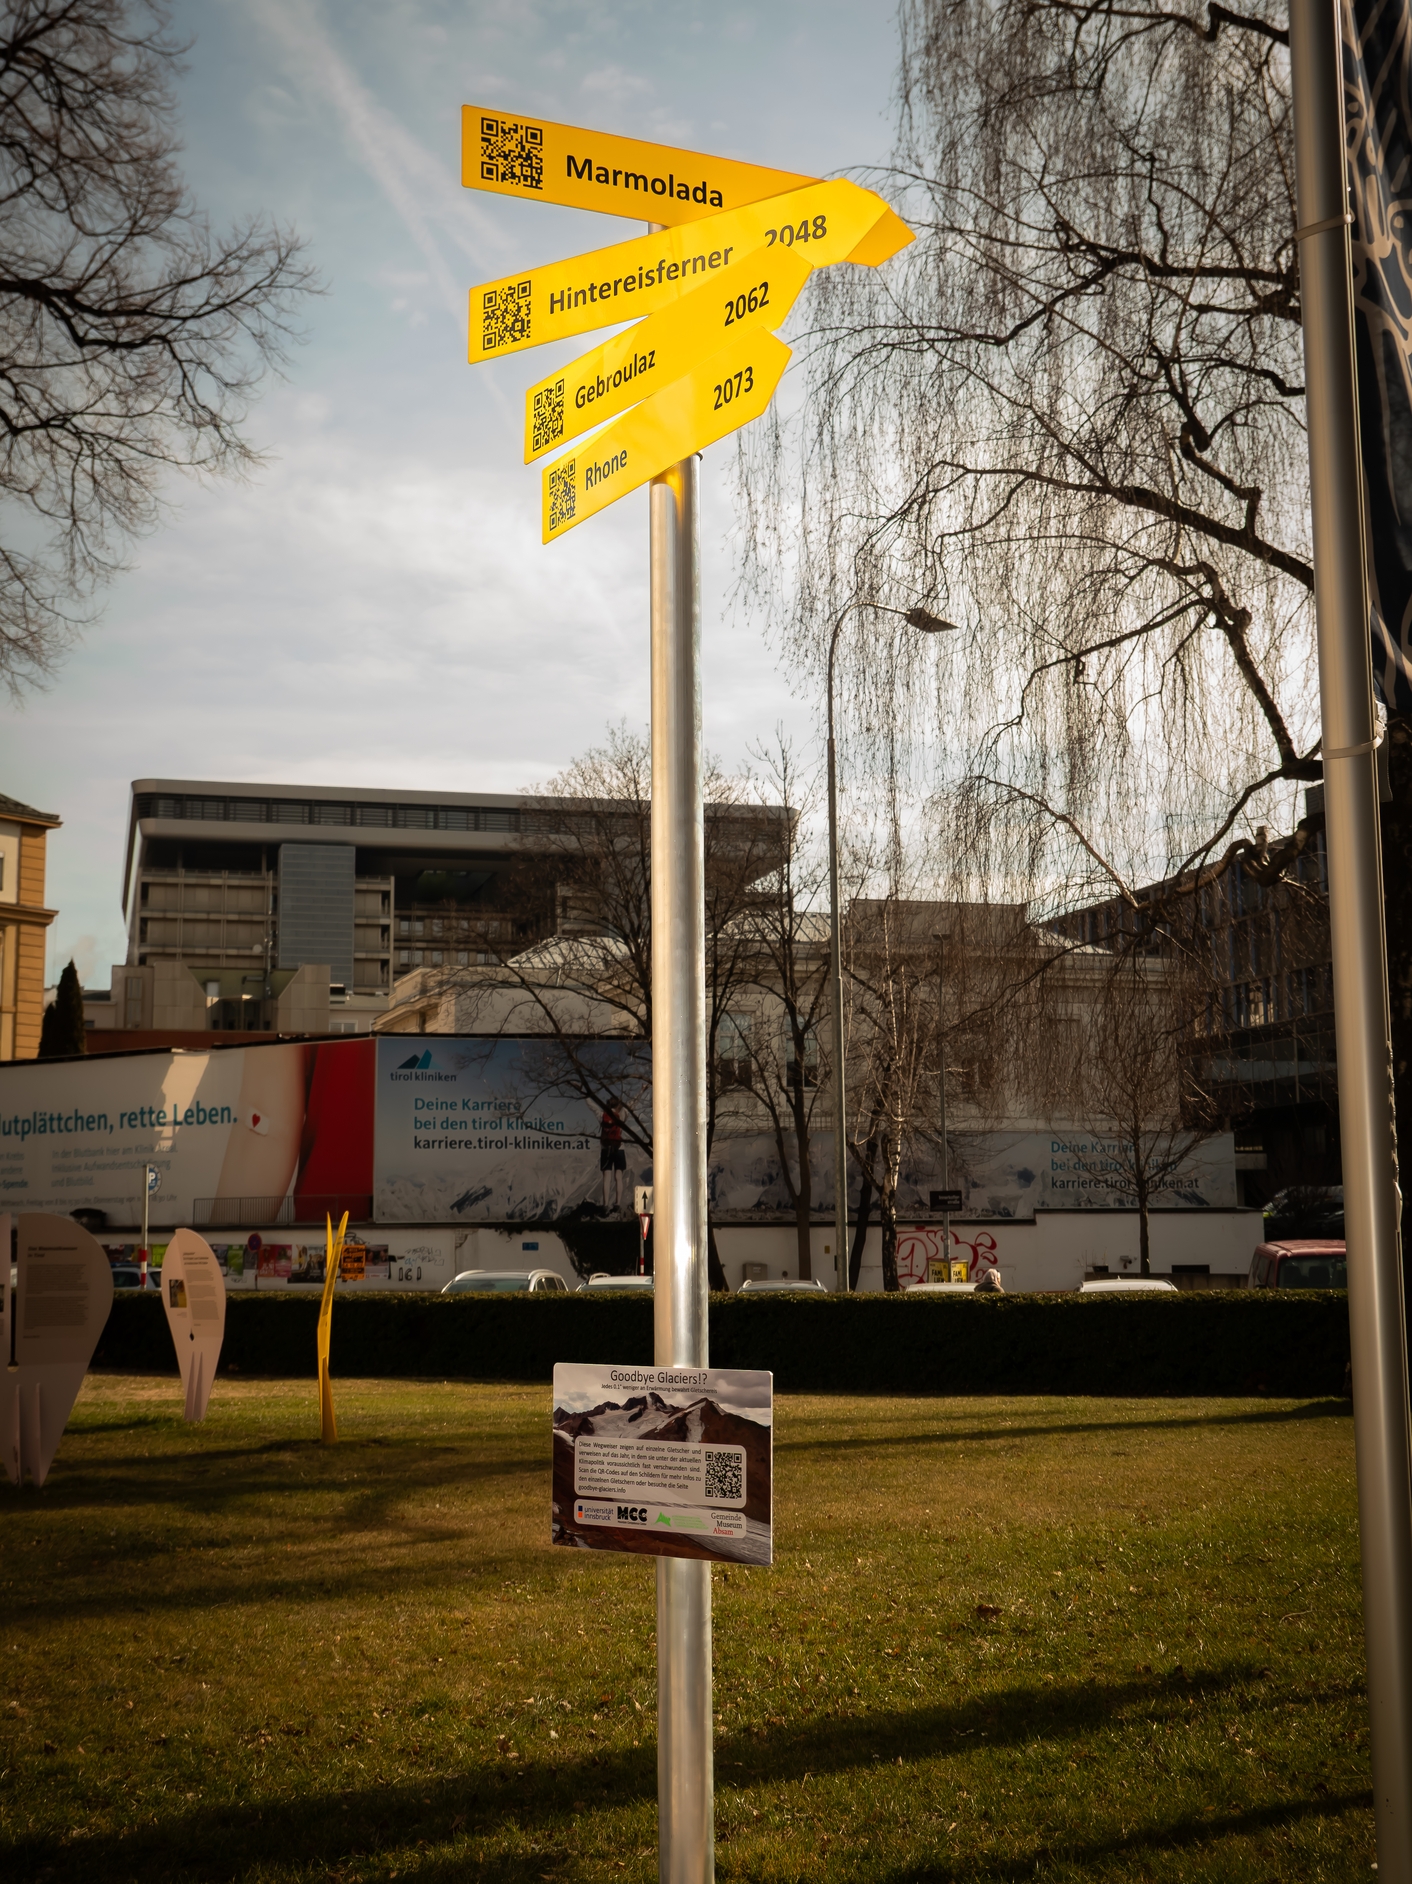
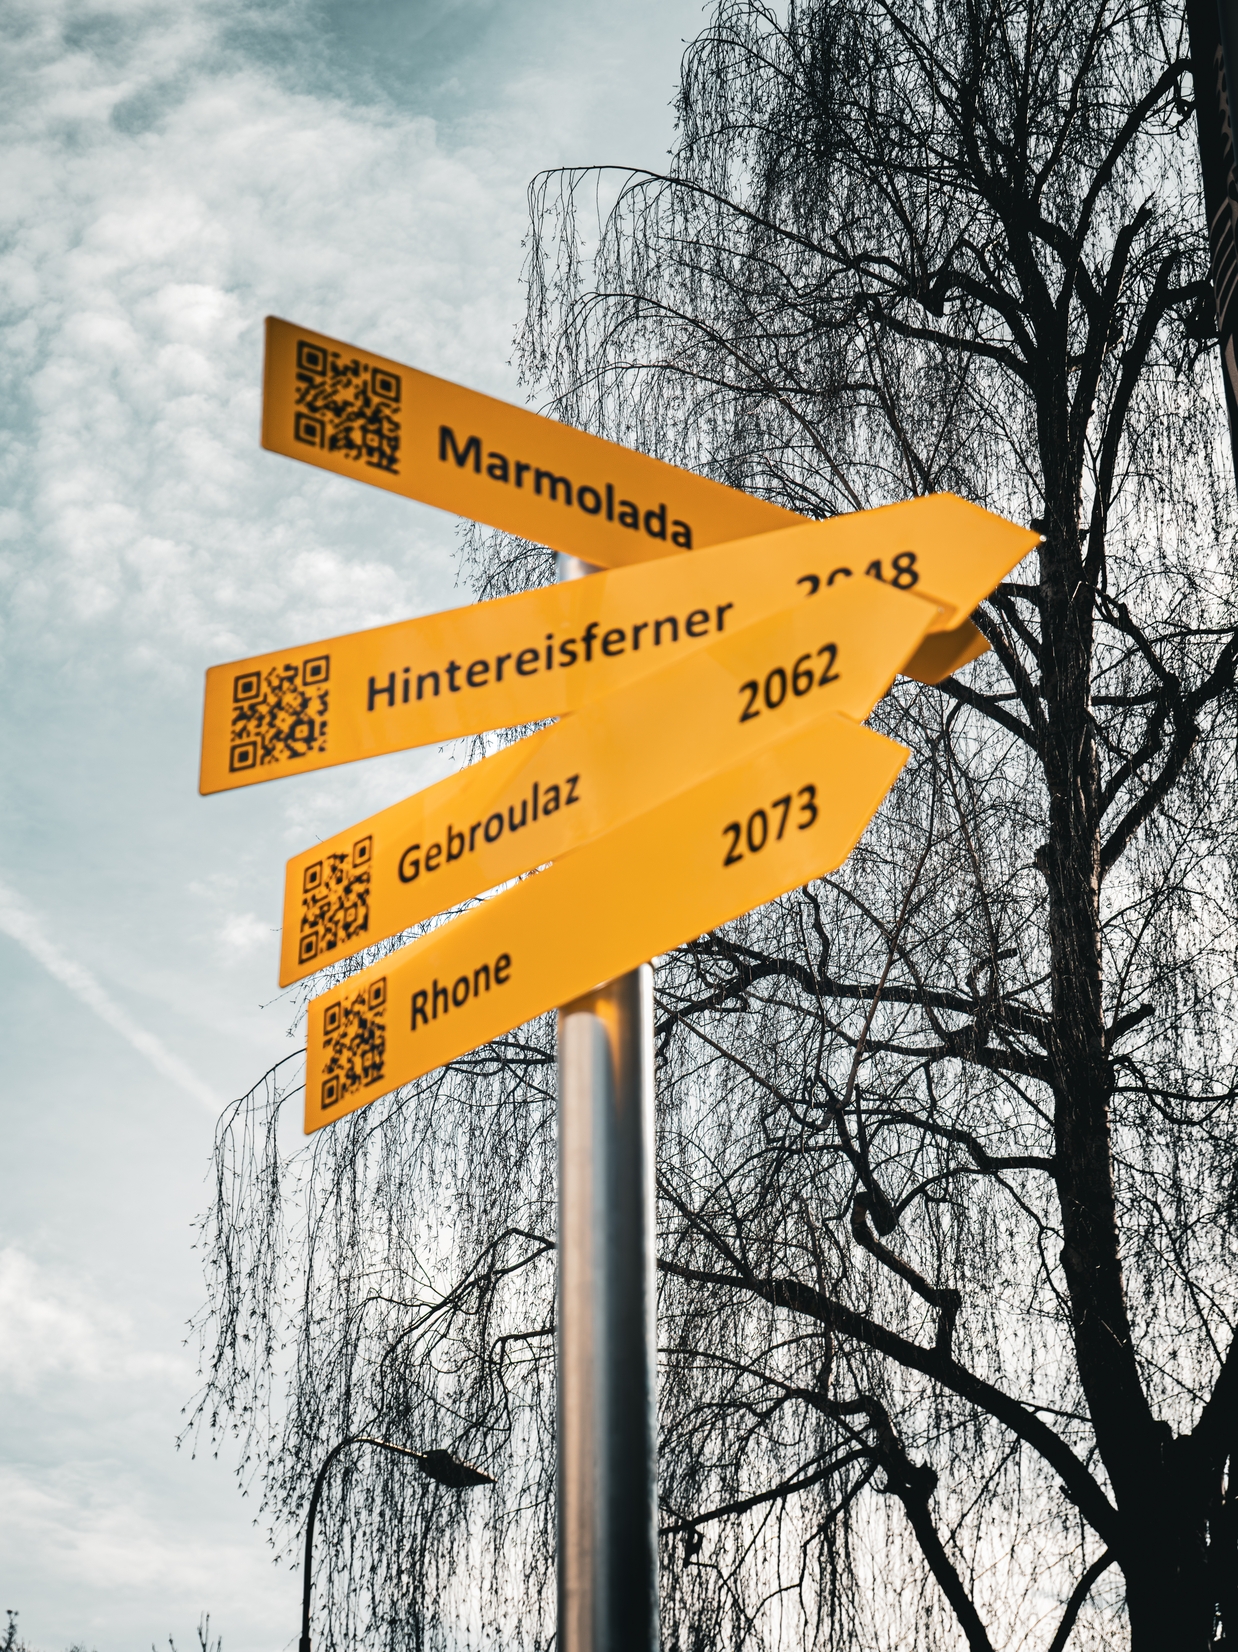
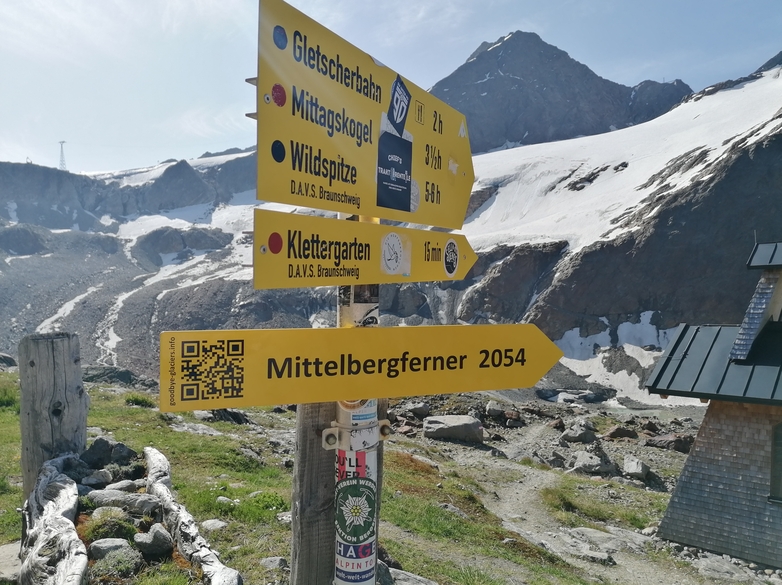
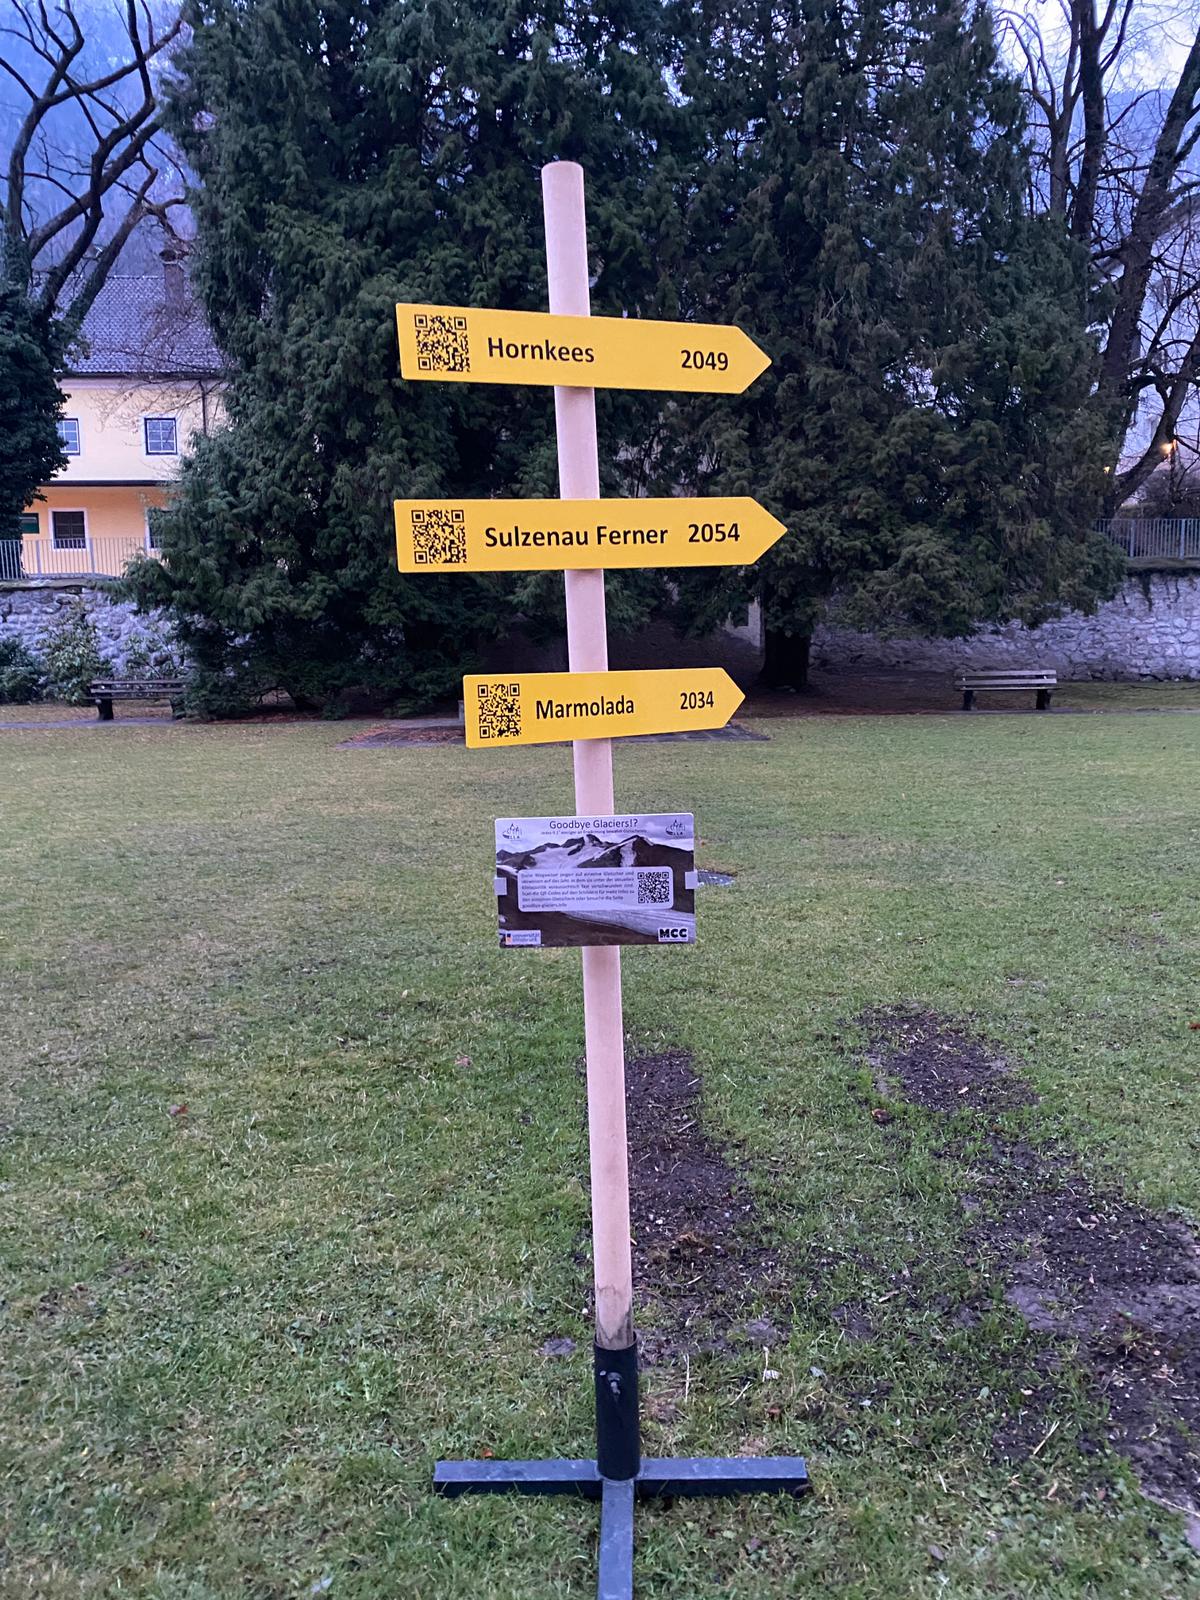
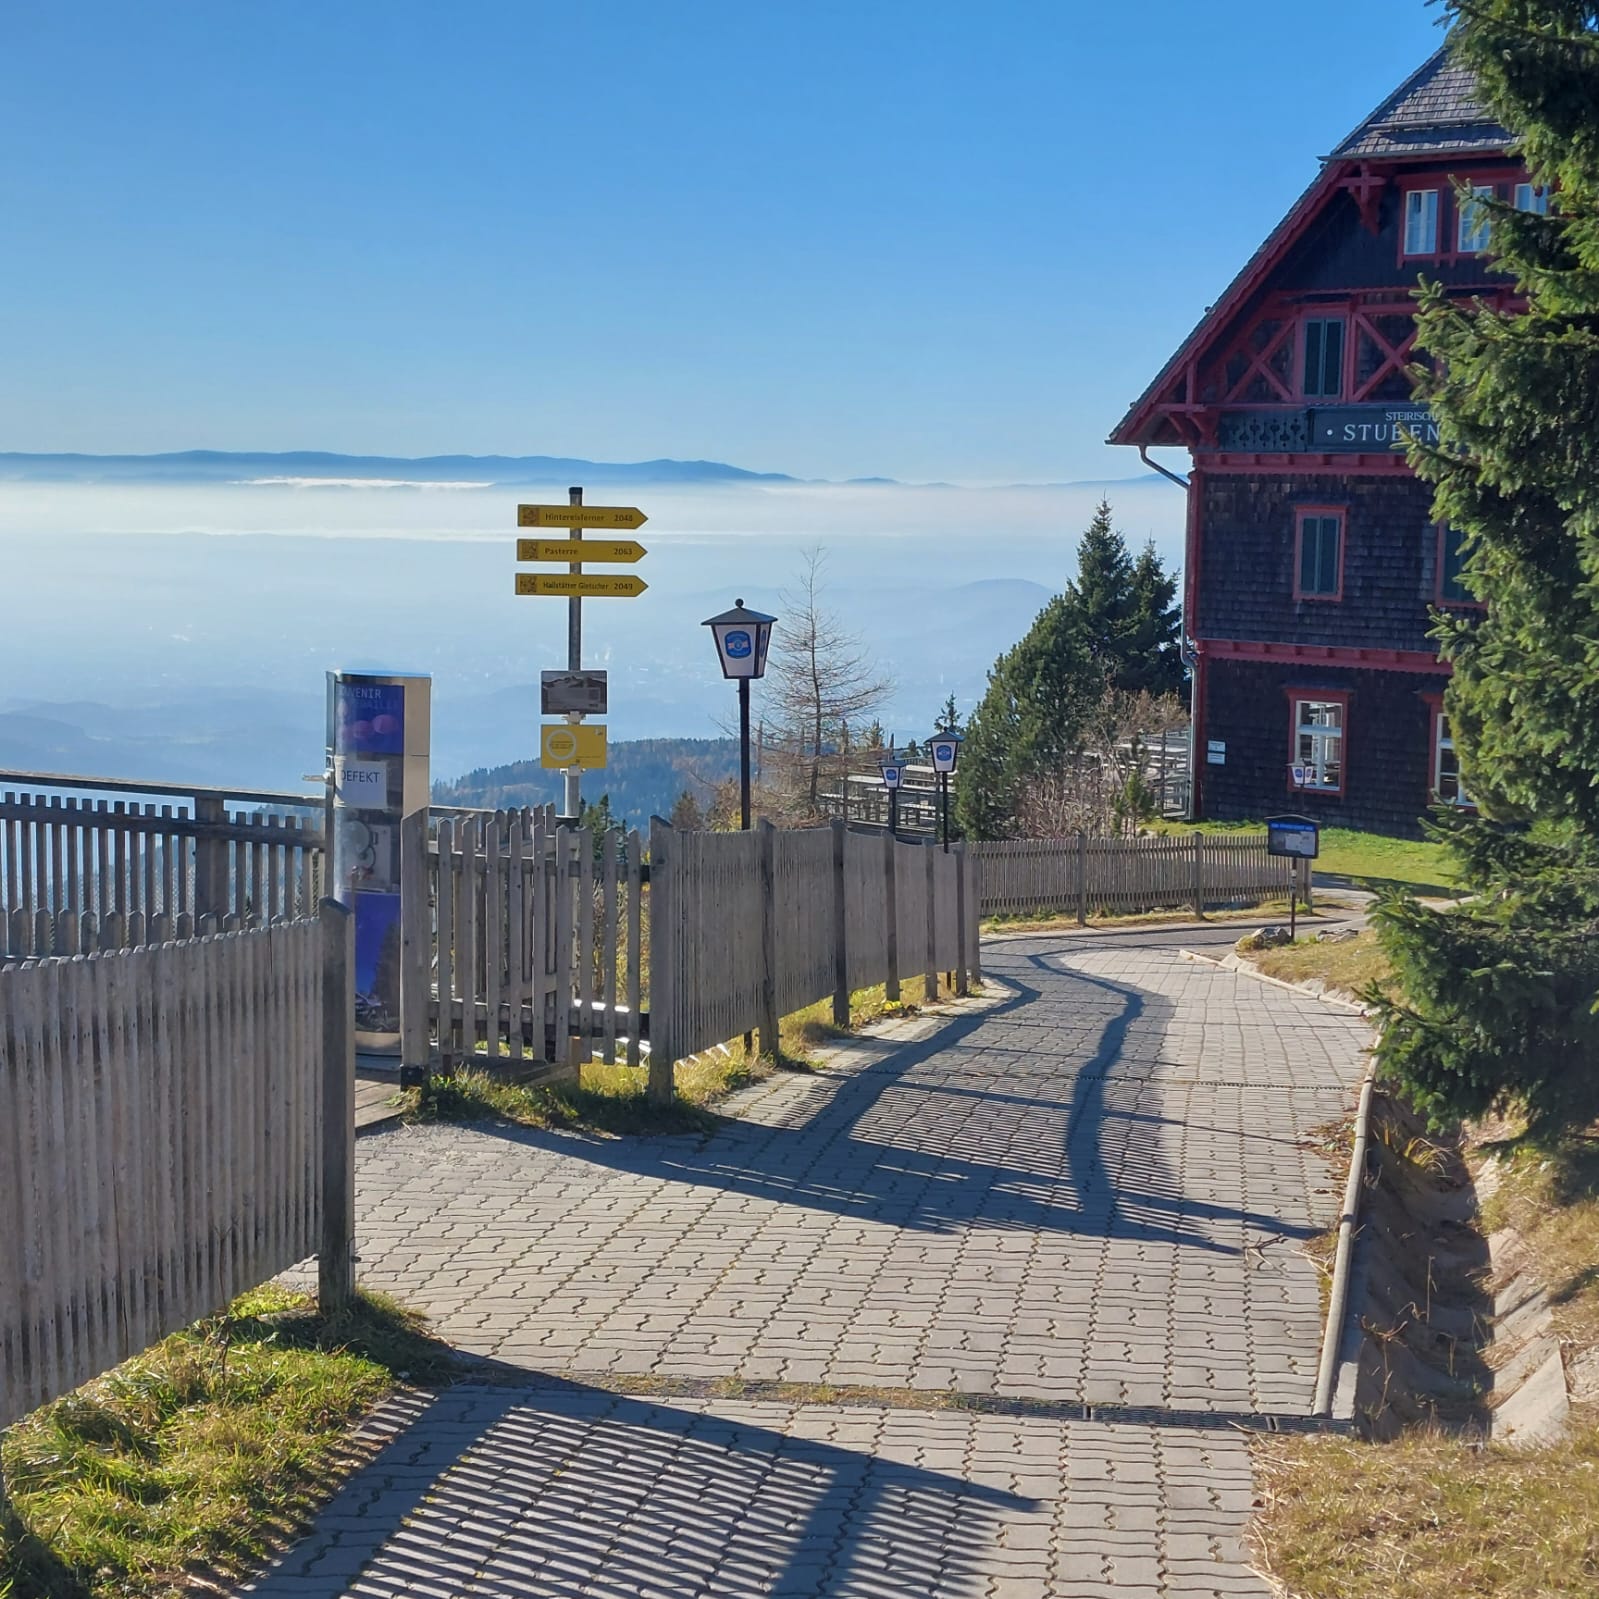
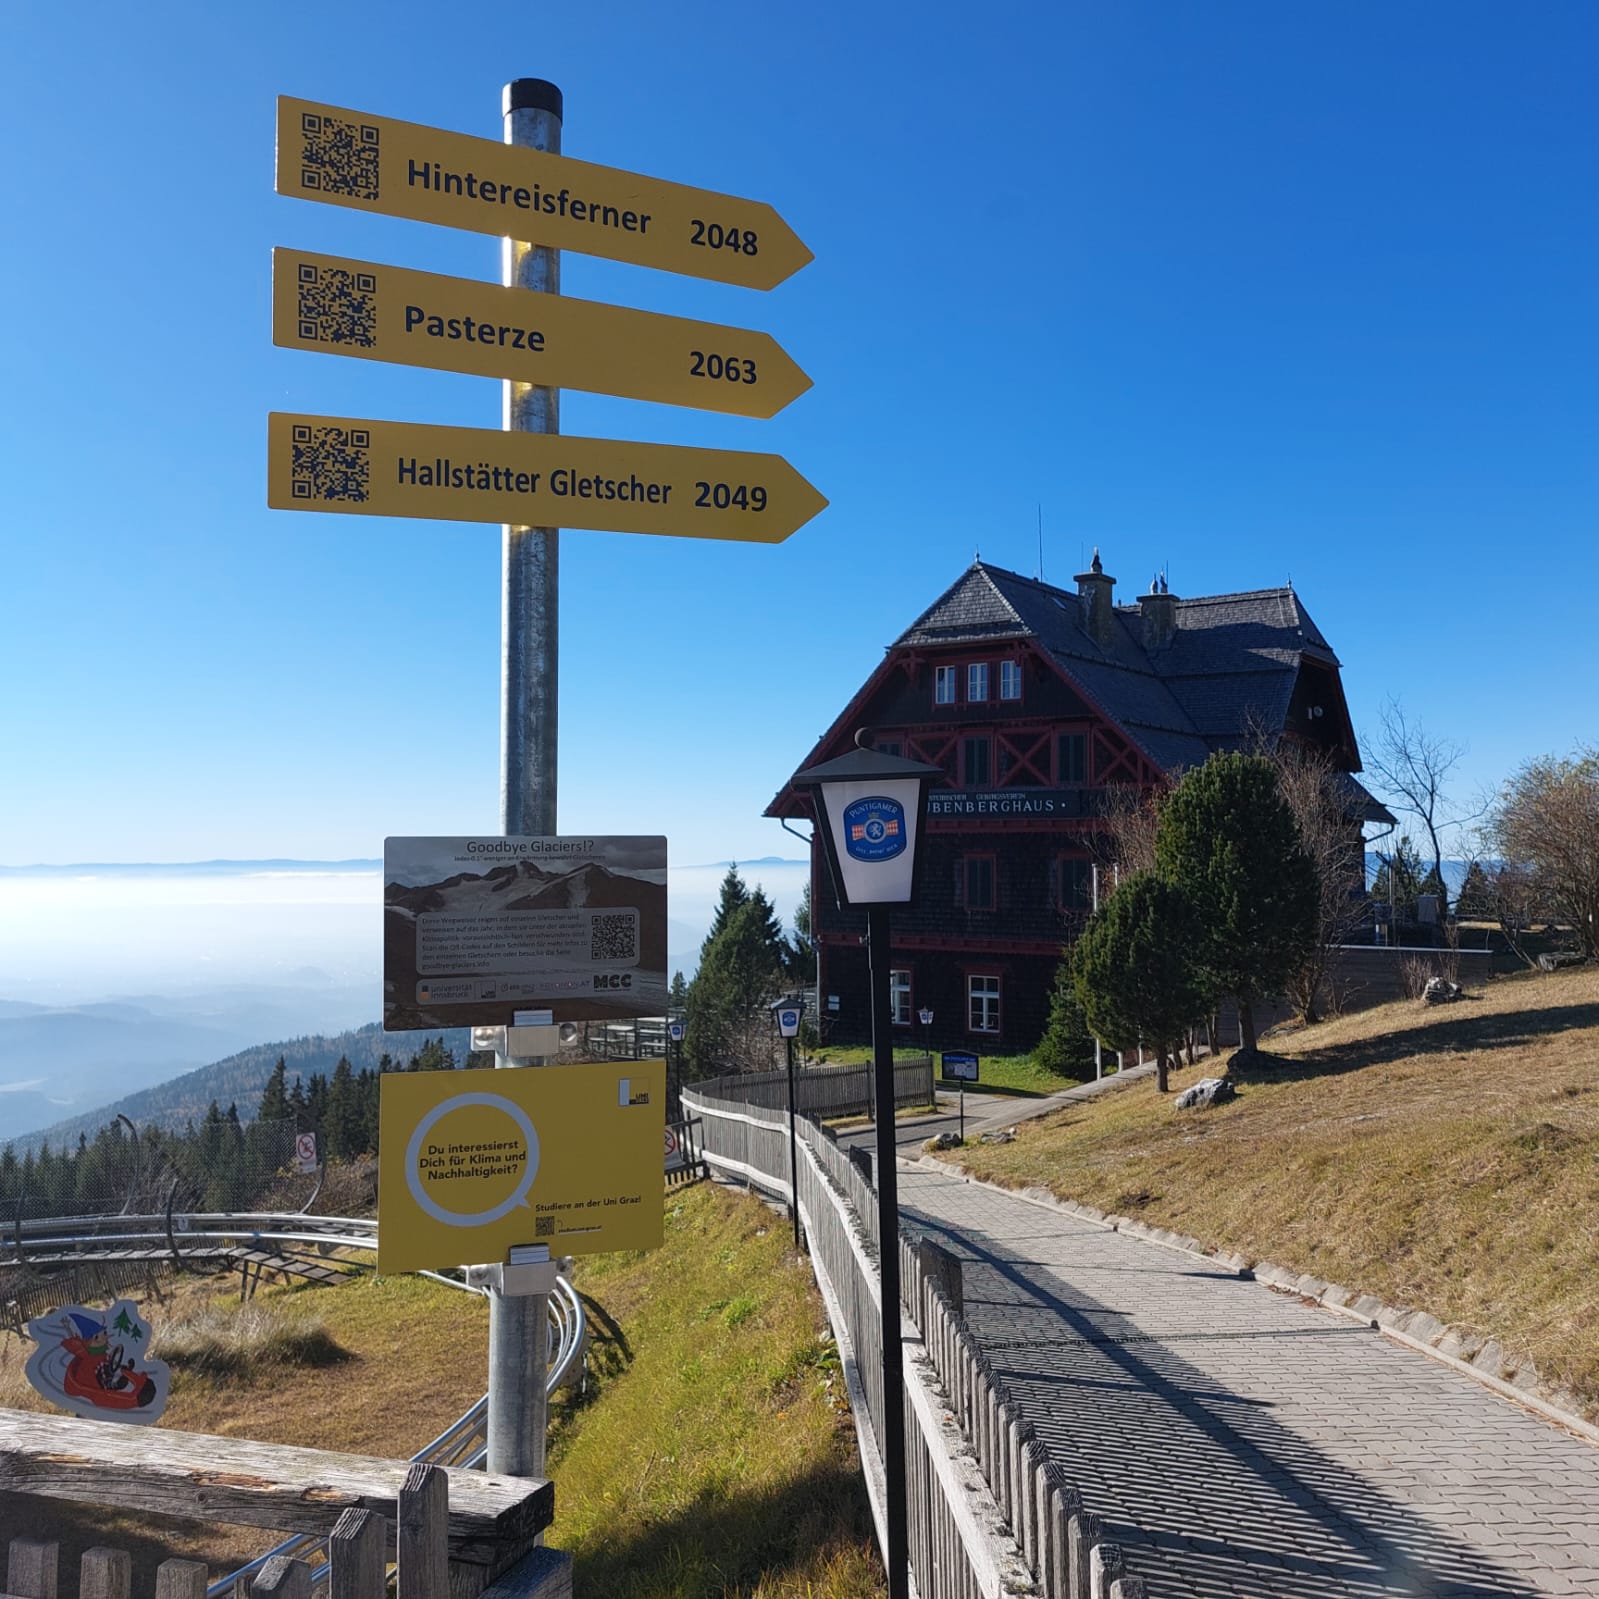
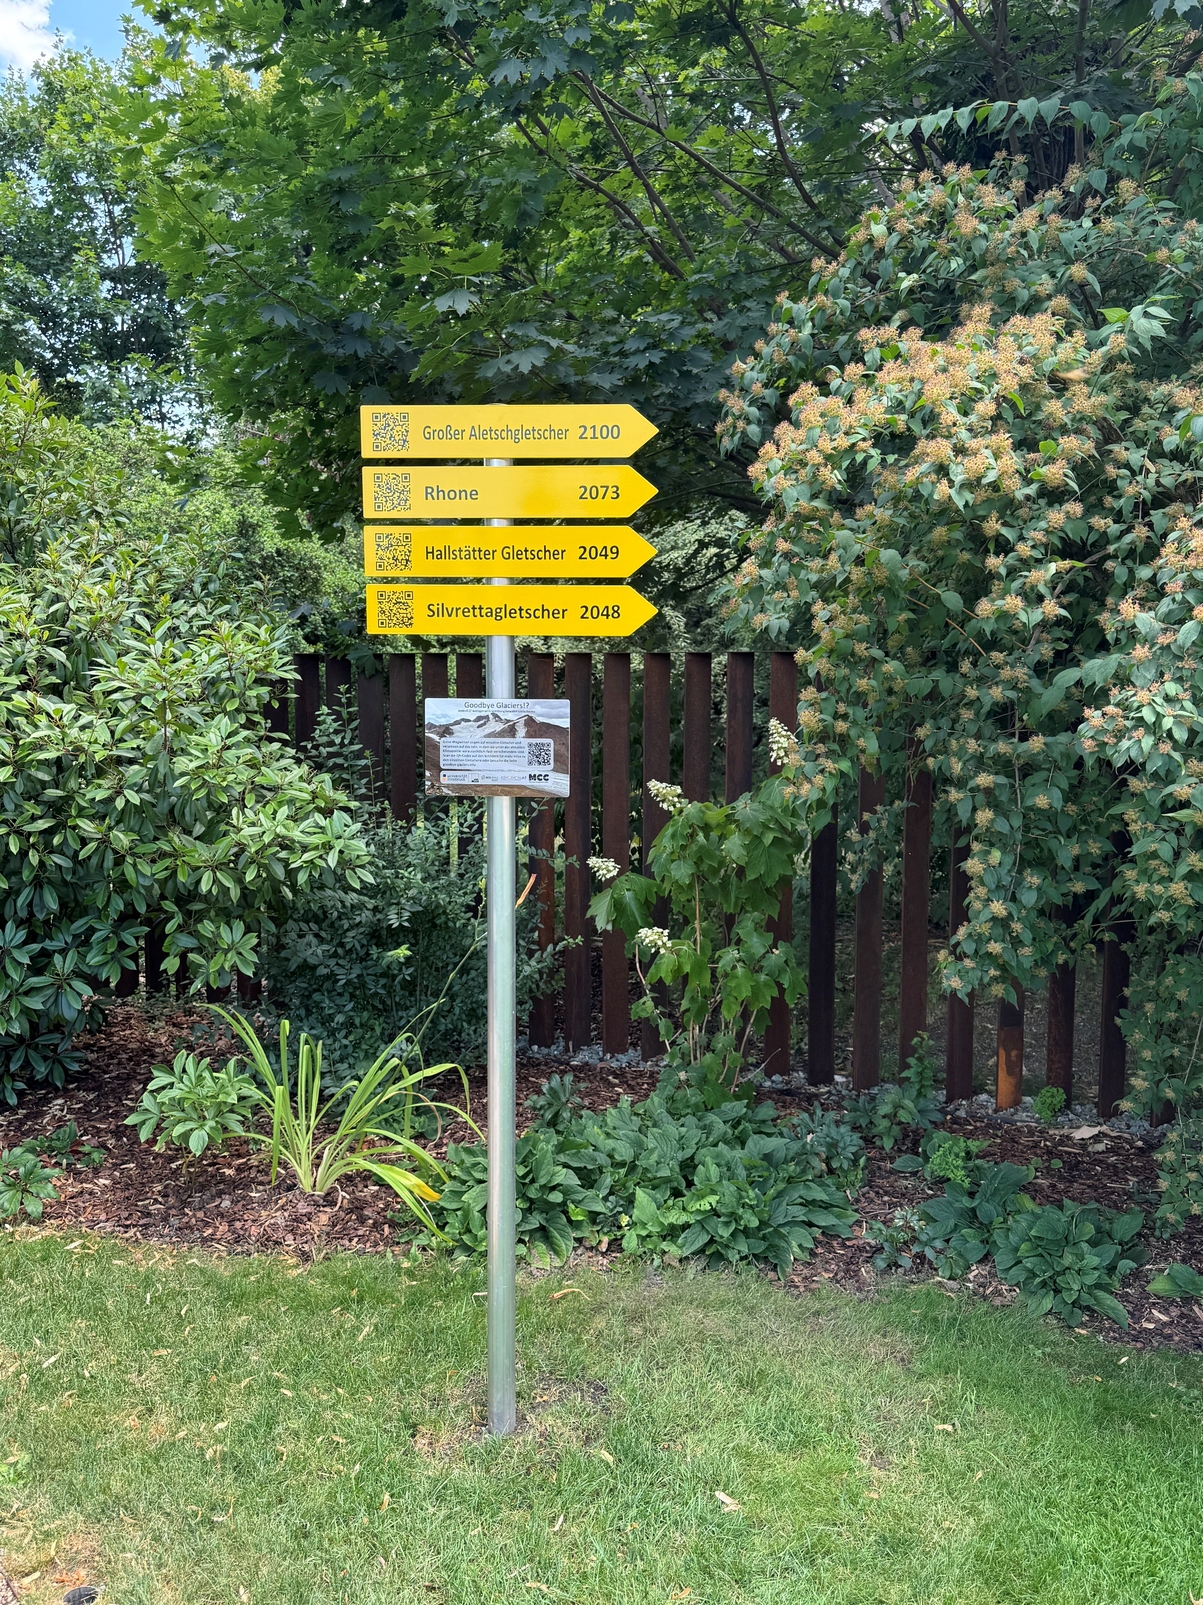
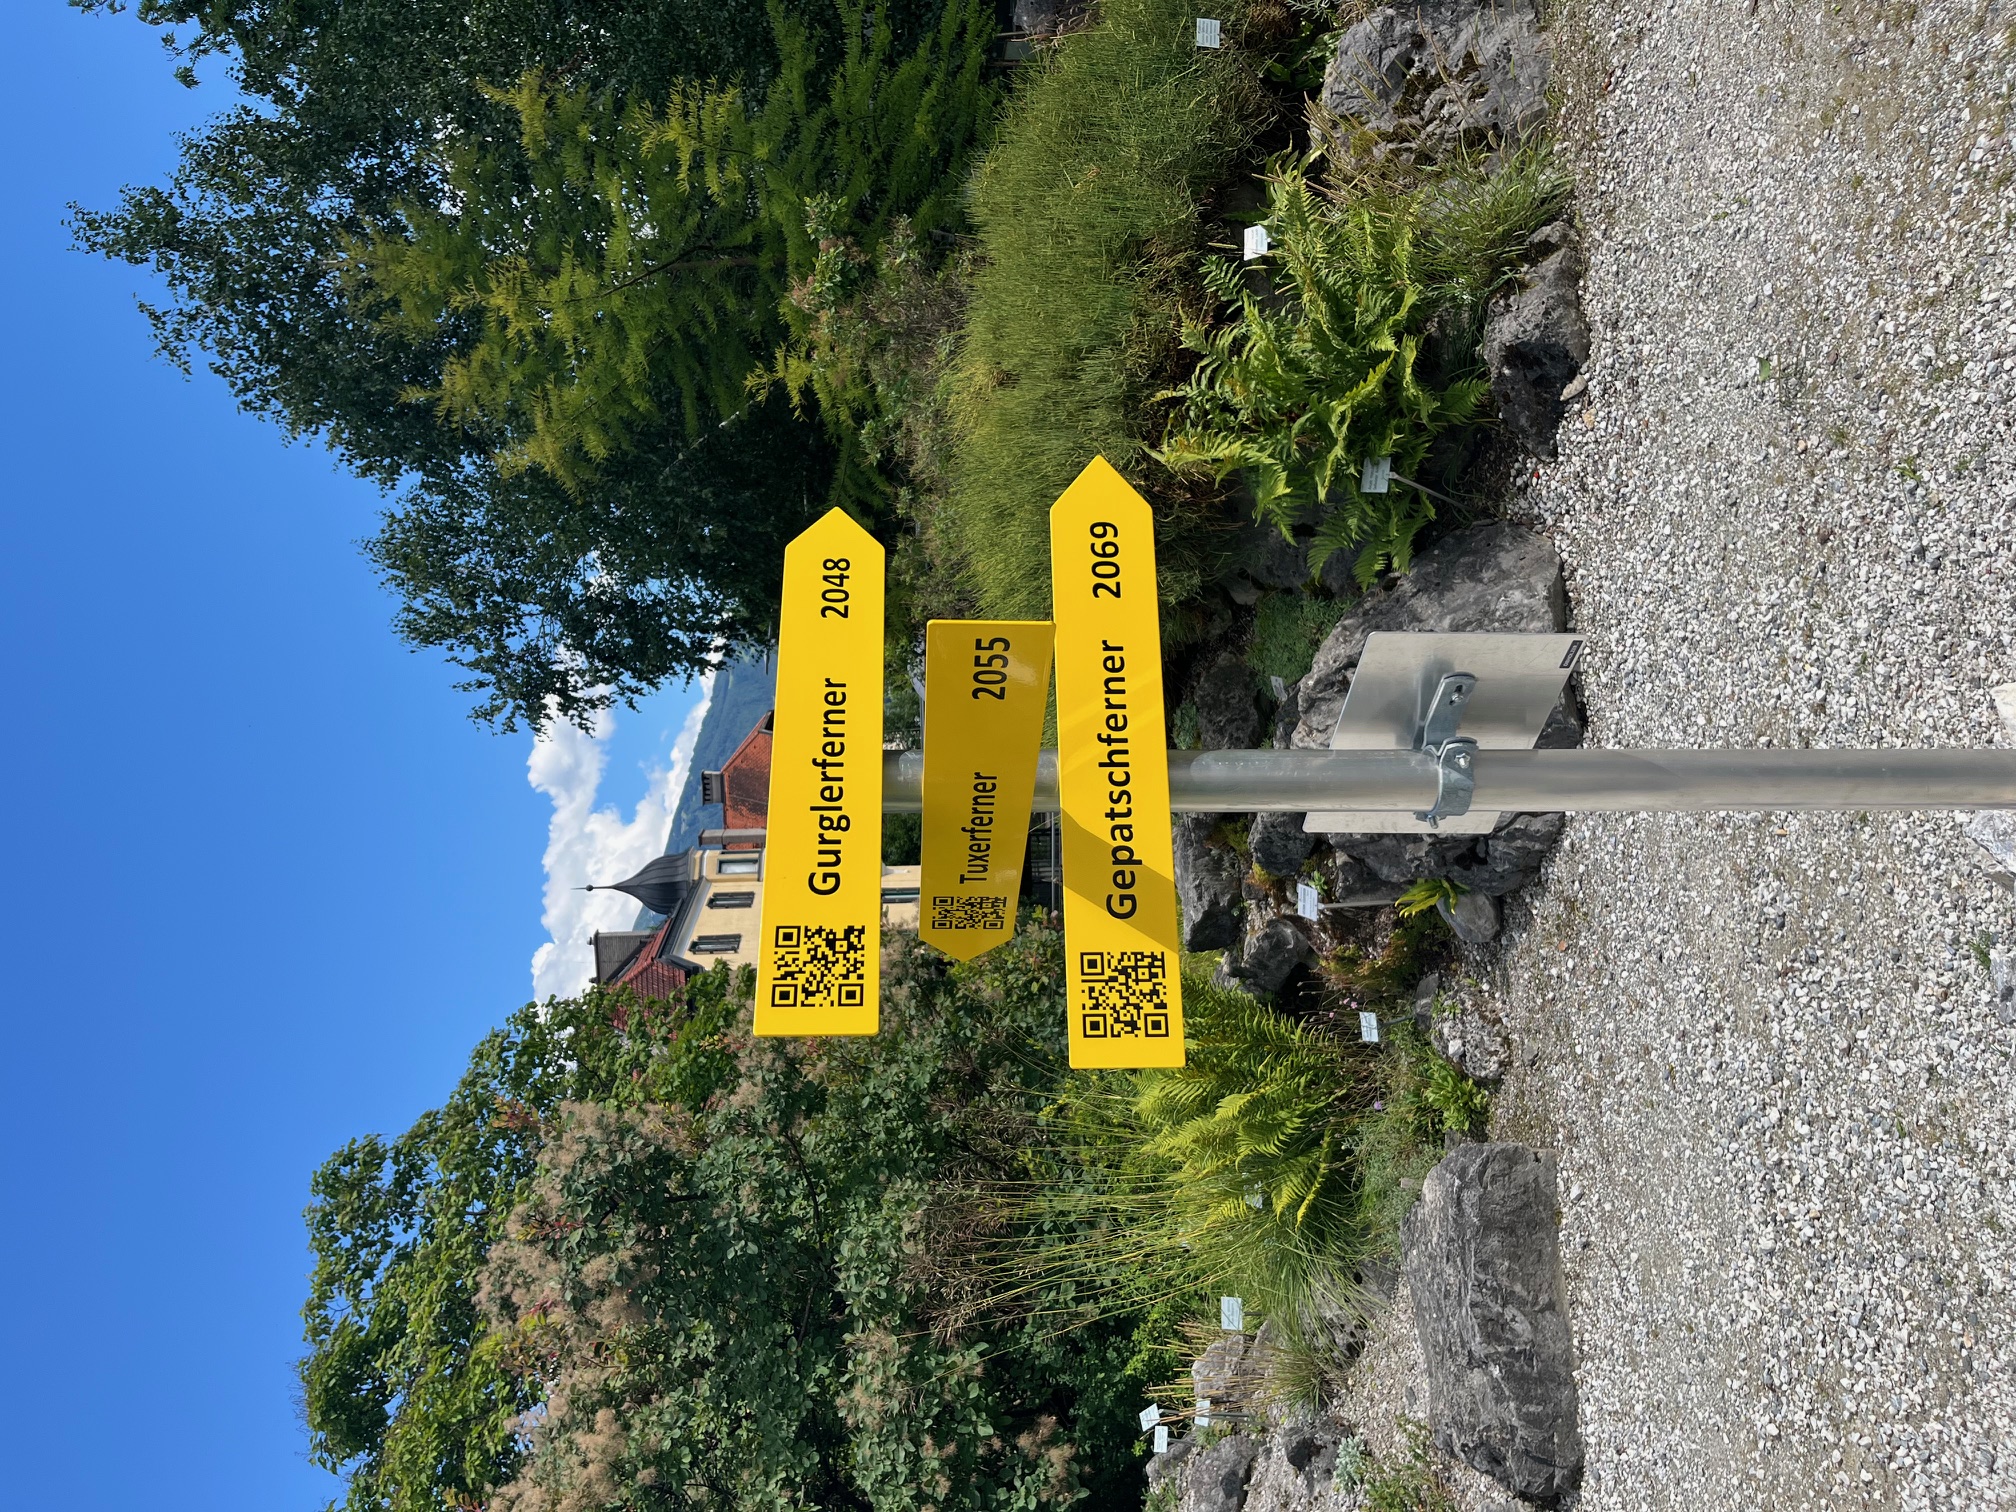
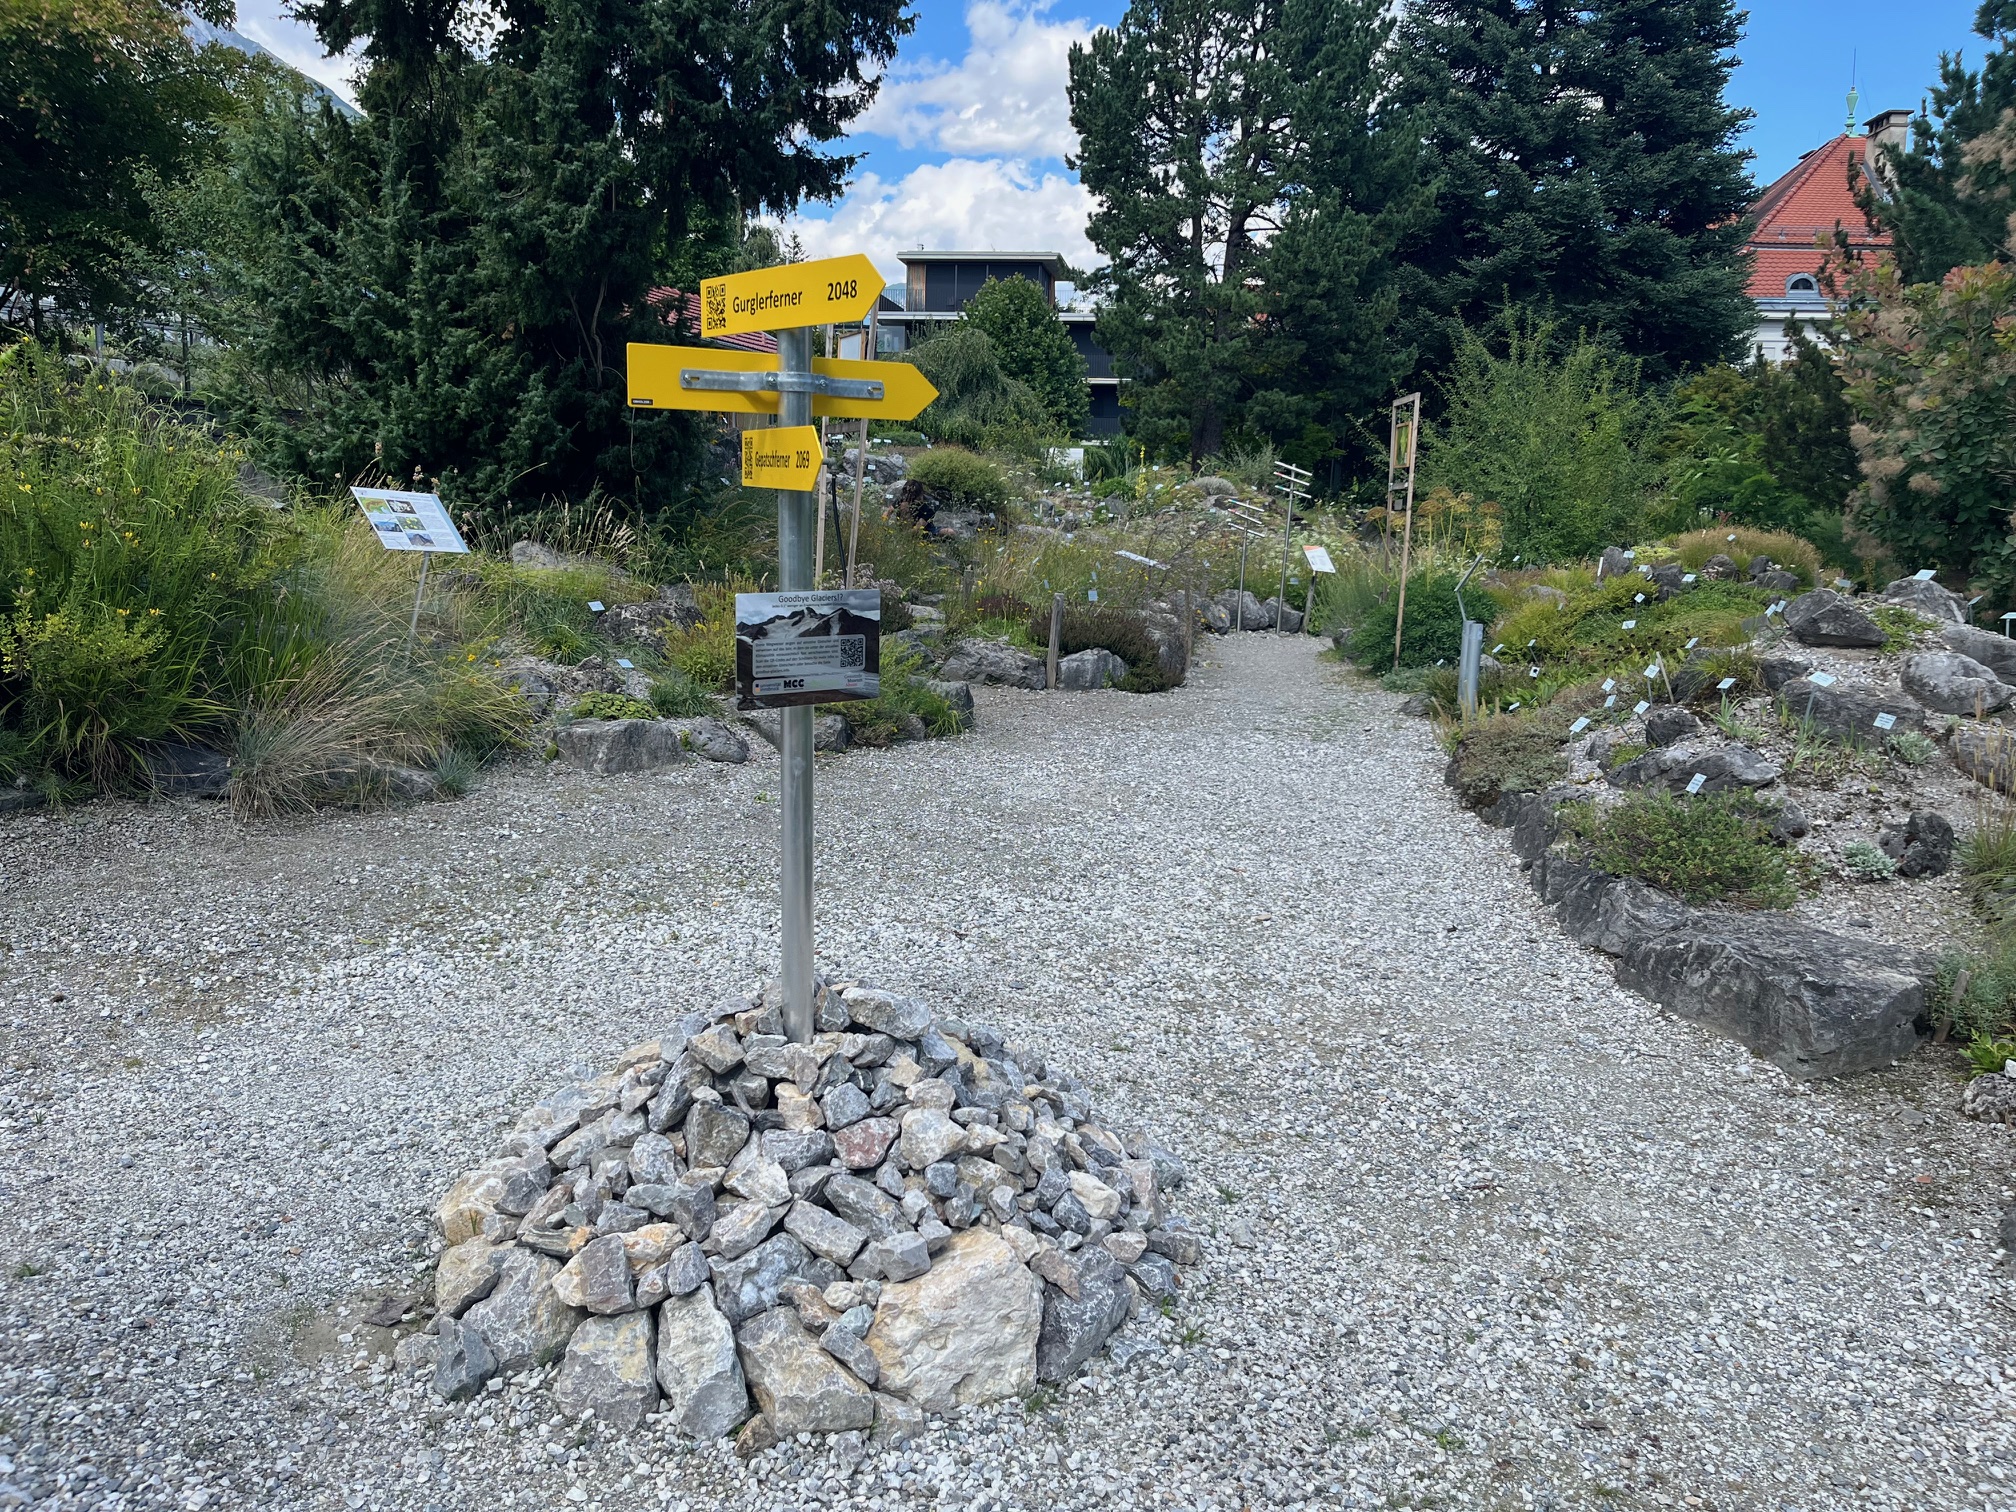
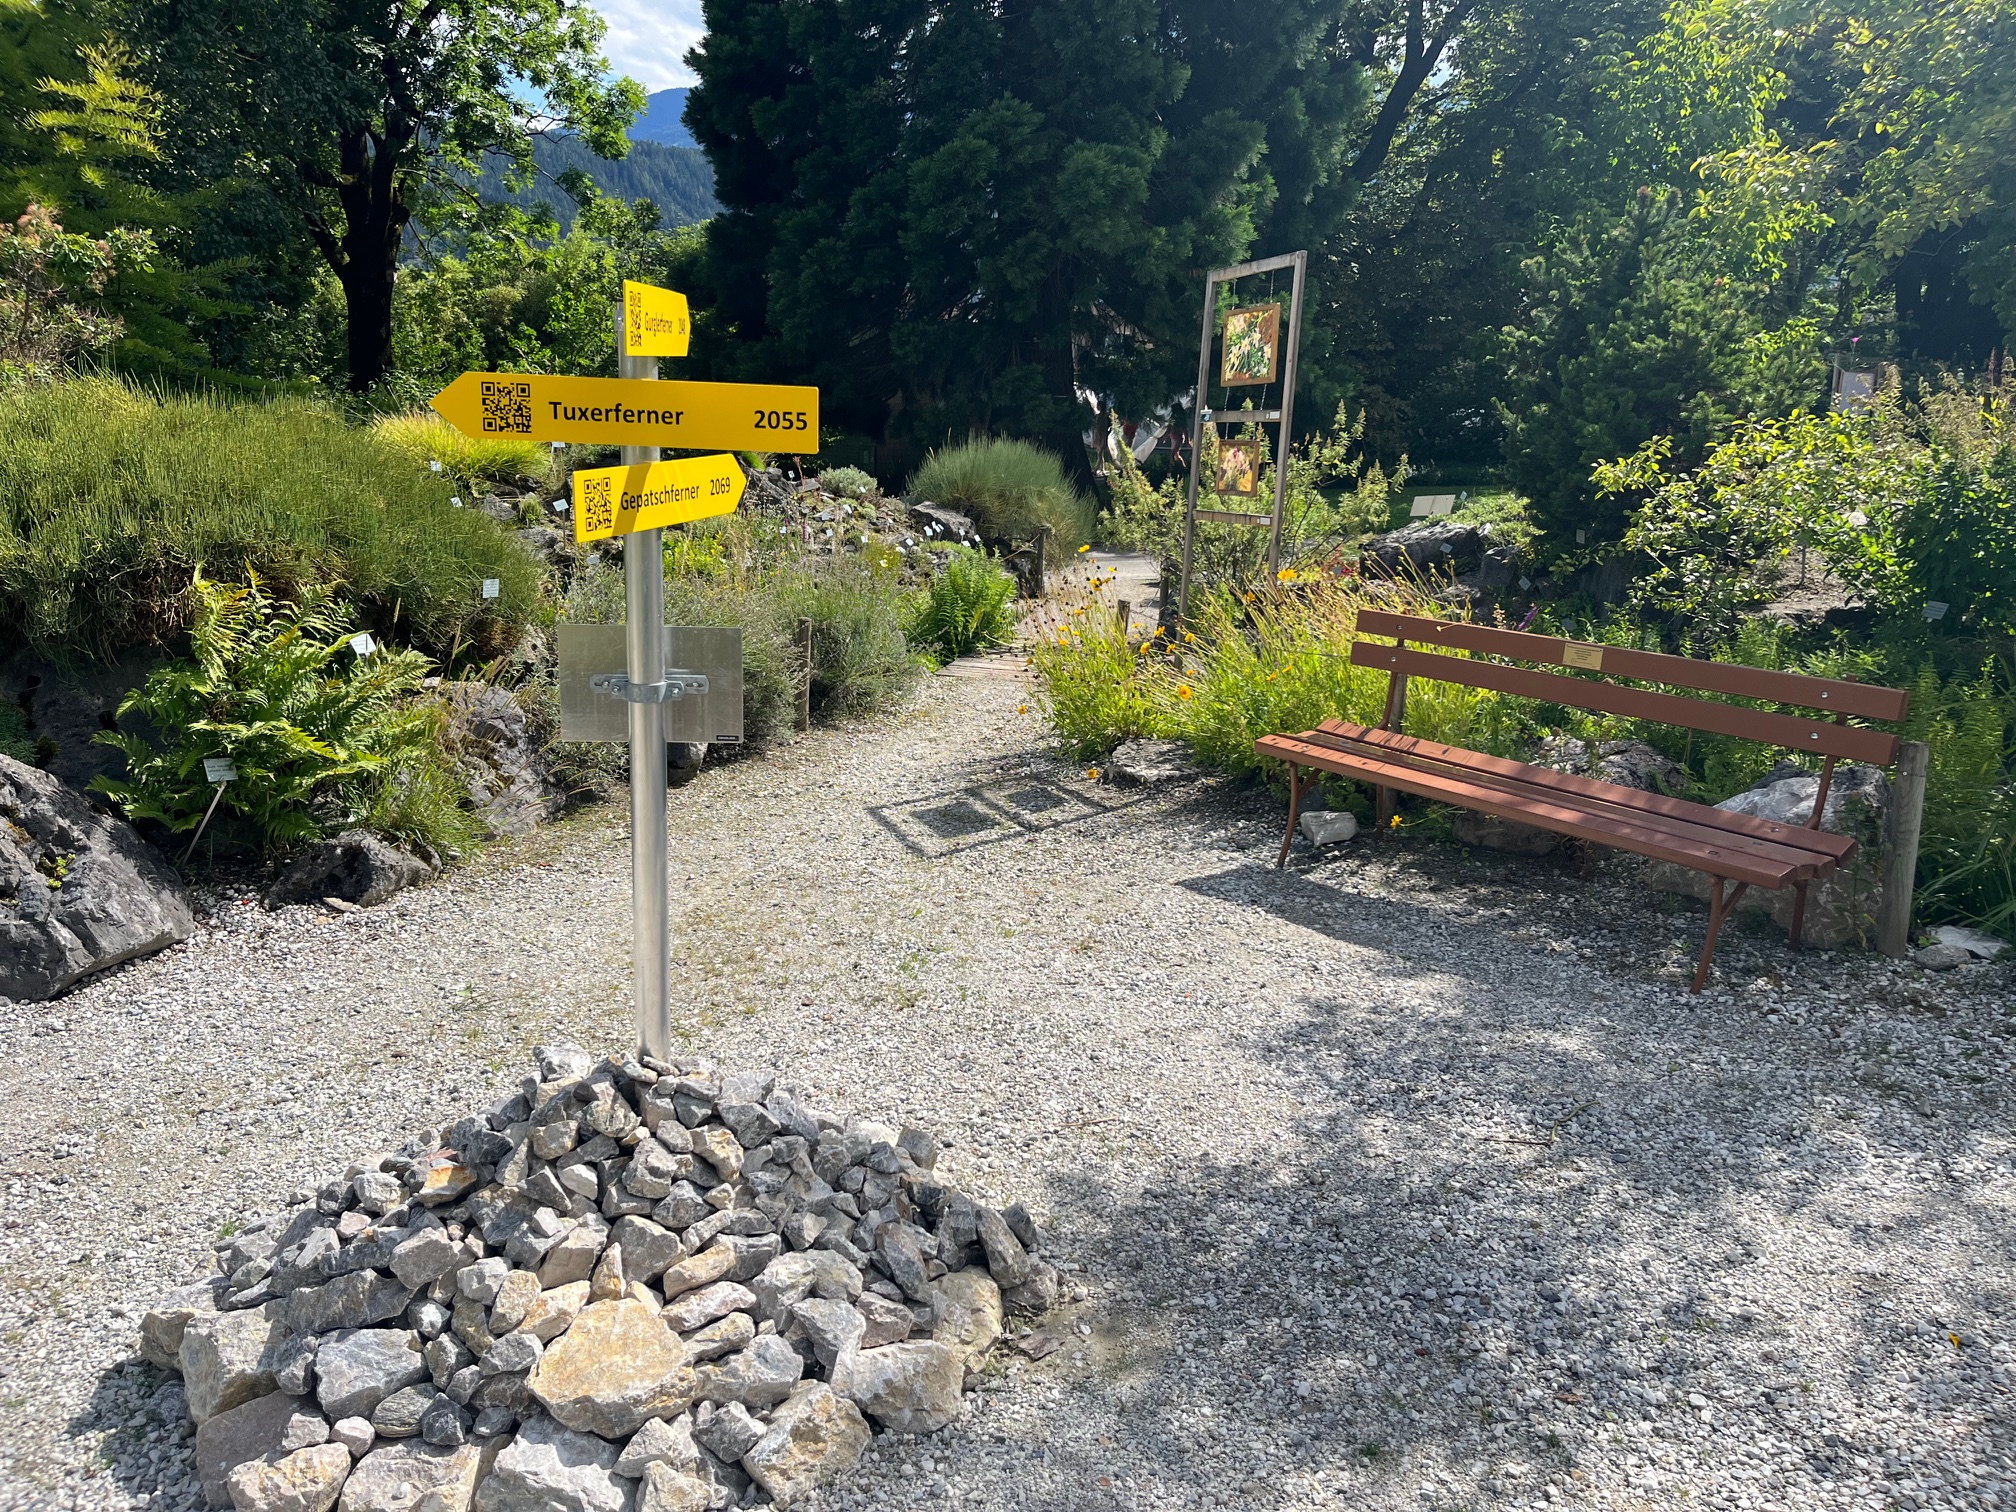
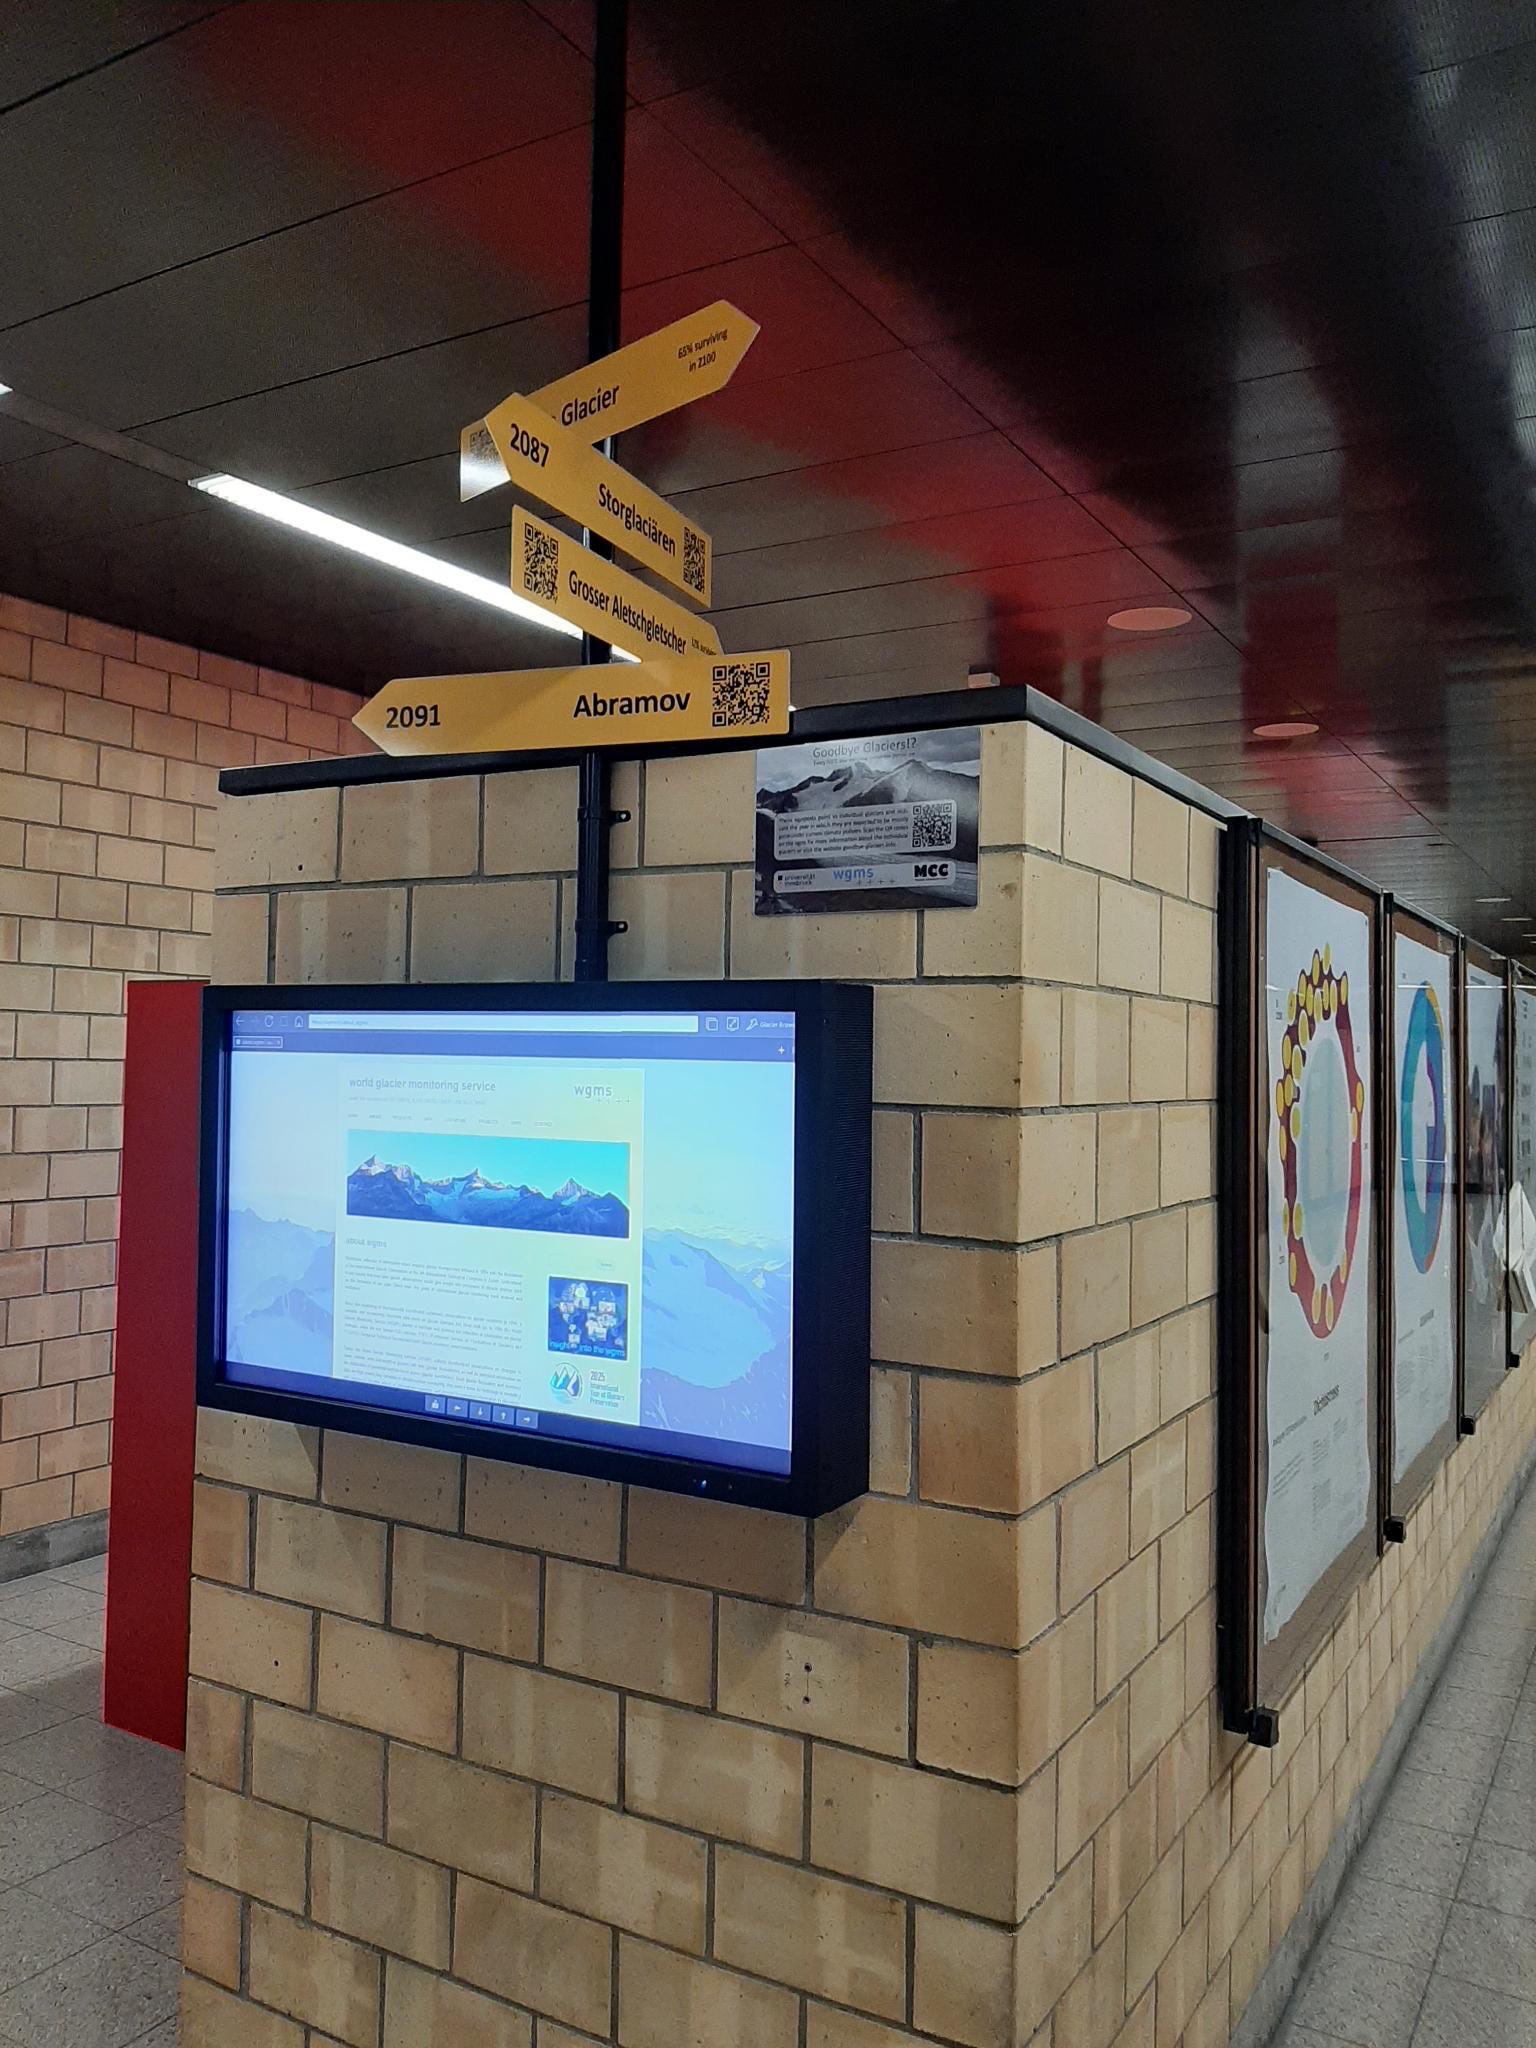
Direction tool
Tool which helps, to mount individual signs pointing into the right direction.